



$SOL (SOL) is experiencing a sharp downward correction after reaching a recent local high near $125. Trading at $109.27, SOL has registered a 5.66% decline over the past 24 hours as bearish selling pressure takes over the immediate trend.
Key Market Metrics
* Current Price: $109.27 USDT (approx. Rs 30,268.88)
* 24h High / Low: $116.81 / $105.71
* 24h Volume: 3.30M SOL (~$367.79M USDT)
* Short-Term Performance: -7.70% (7 Days)
* Medium-Term Performance: +40.99% (90 Days)
Technical Chart Breakdown
1. Rejection at Resistance ($124.95)
After a strong bullish surge from its multi-week low around $72.43, SOL hit resistance at $124.95. Buyers struggled to consolidate above $120, leading to a breakdown below key support zones.
2. Sharp Red Candle Signals Increased Volatility
The latest daily candlestick reveals strong momentum to the downside, breaking past $115 and briefly testing the $105.71 level before stabilizing slightly around $109.
3. Key Levels to Watch
* Immediate Support: $104.47 - $105.70 (Crucial zone to prevent further downside toward $92.91)
* Key Resistance: $116.02 - $124.95 (Must reclaim to reignite the broader bullish rally)
Market Sentiment & Order Book Flow
Despite the recent price drop, the order book sentiment remains heavily tilted toward buyers, with 84.44% buy volume versus 15.56% sell volume. This disparity suggests significant accumulation or limit orders placed by traders looking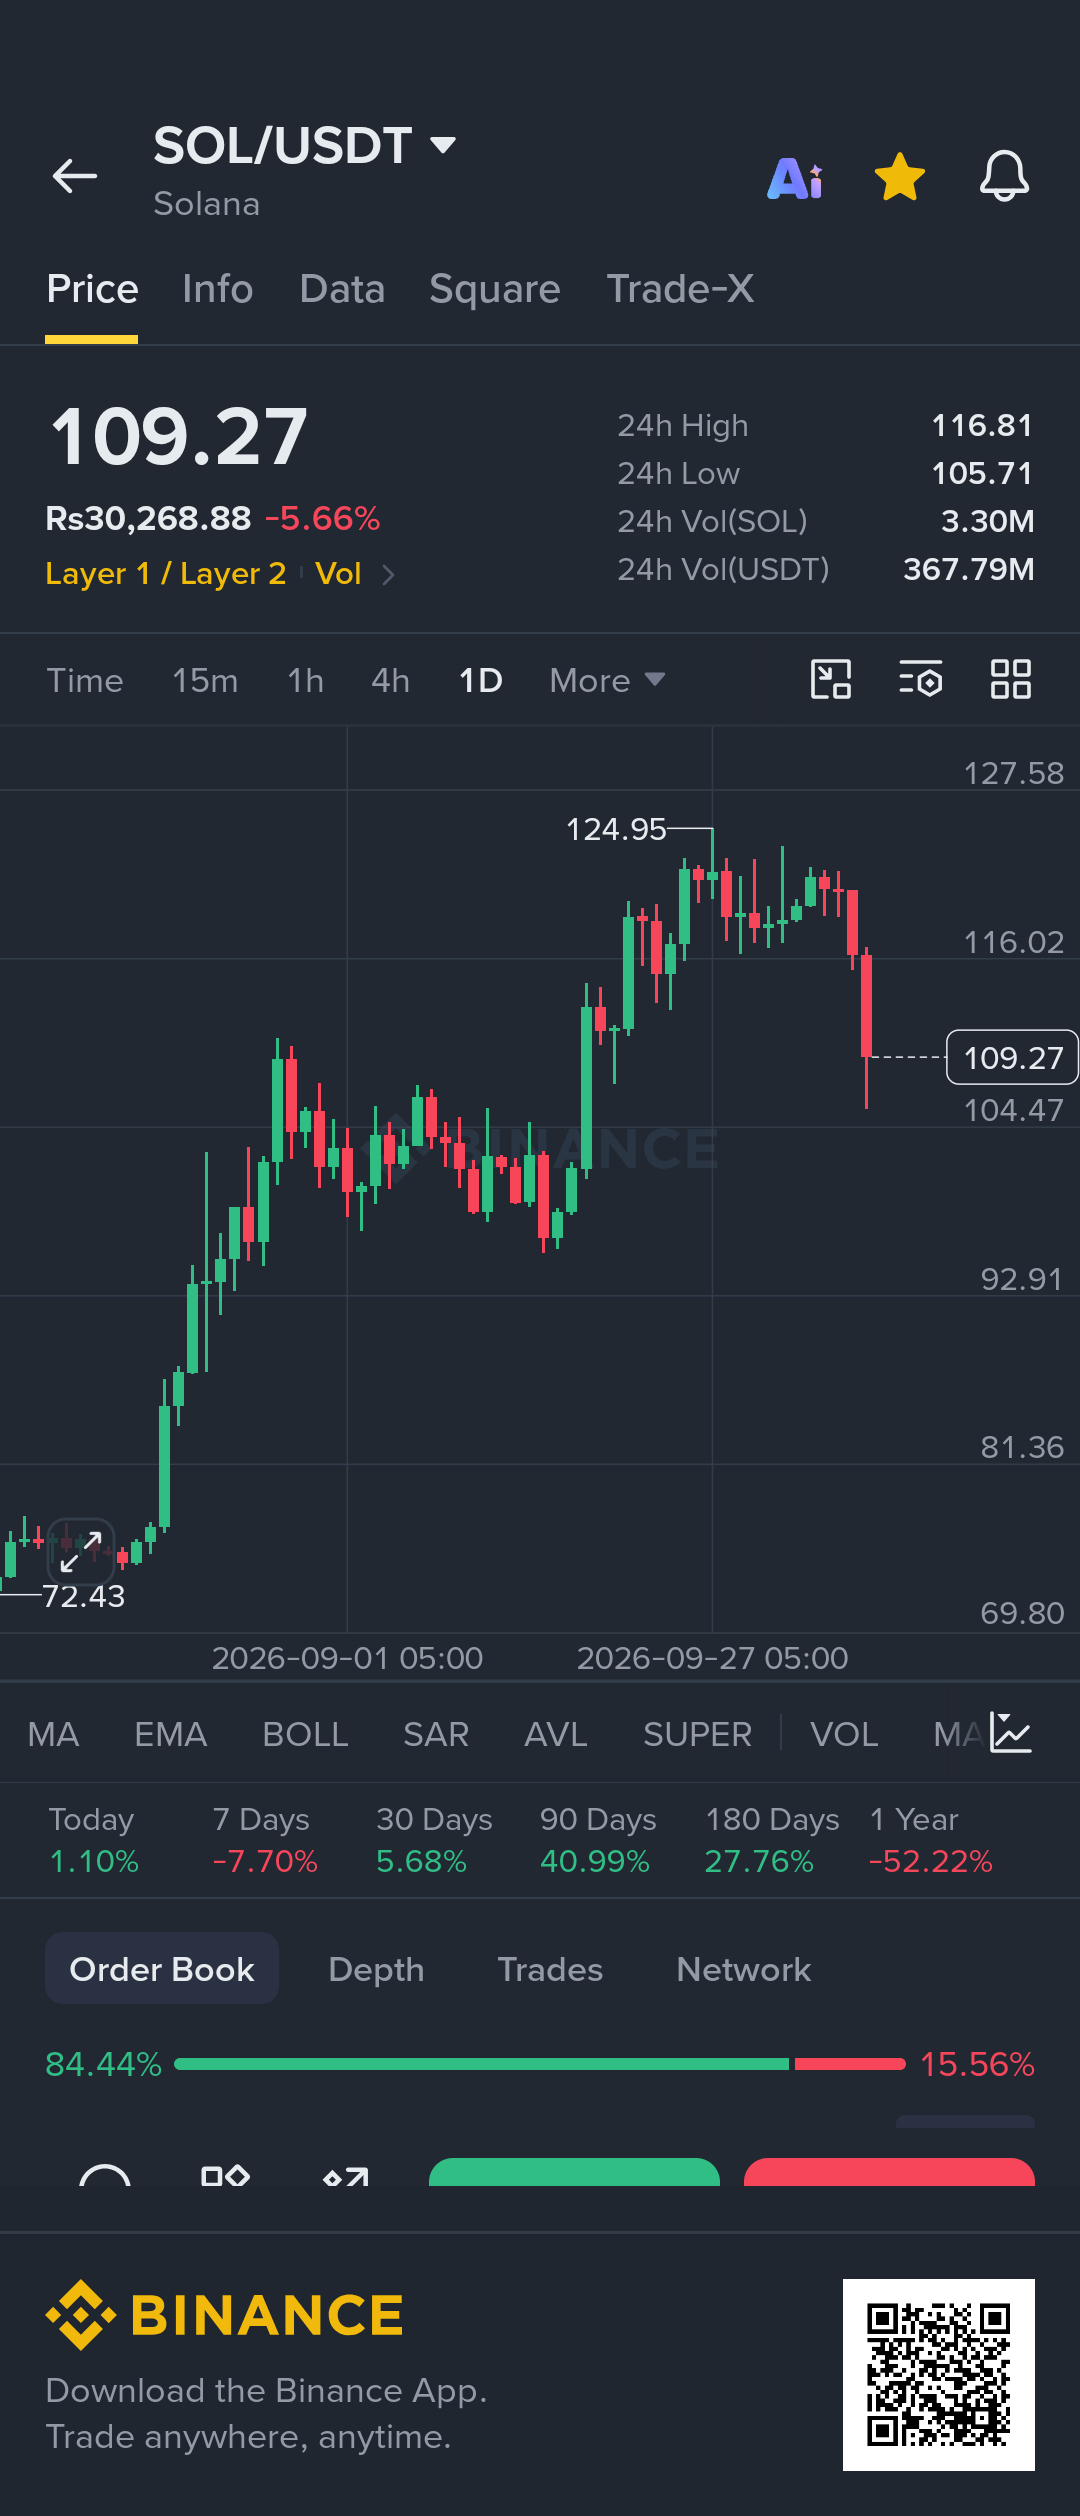 to buy the dip around the $105–$109 range.
Market Outlook
While SOL remains down 7.70% over 7 days, its 90-day return of +40.99% indicates that the broader medium-term structure remains intact. However, if selling pressure continues and SOL fails to hold the $105 support level, the token could test lower support around $92.91. Conversely, a quick rebound above $116 would signal a potential end to the
current correction.#TrendingTopic