
1. Price Info:*
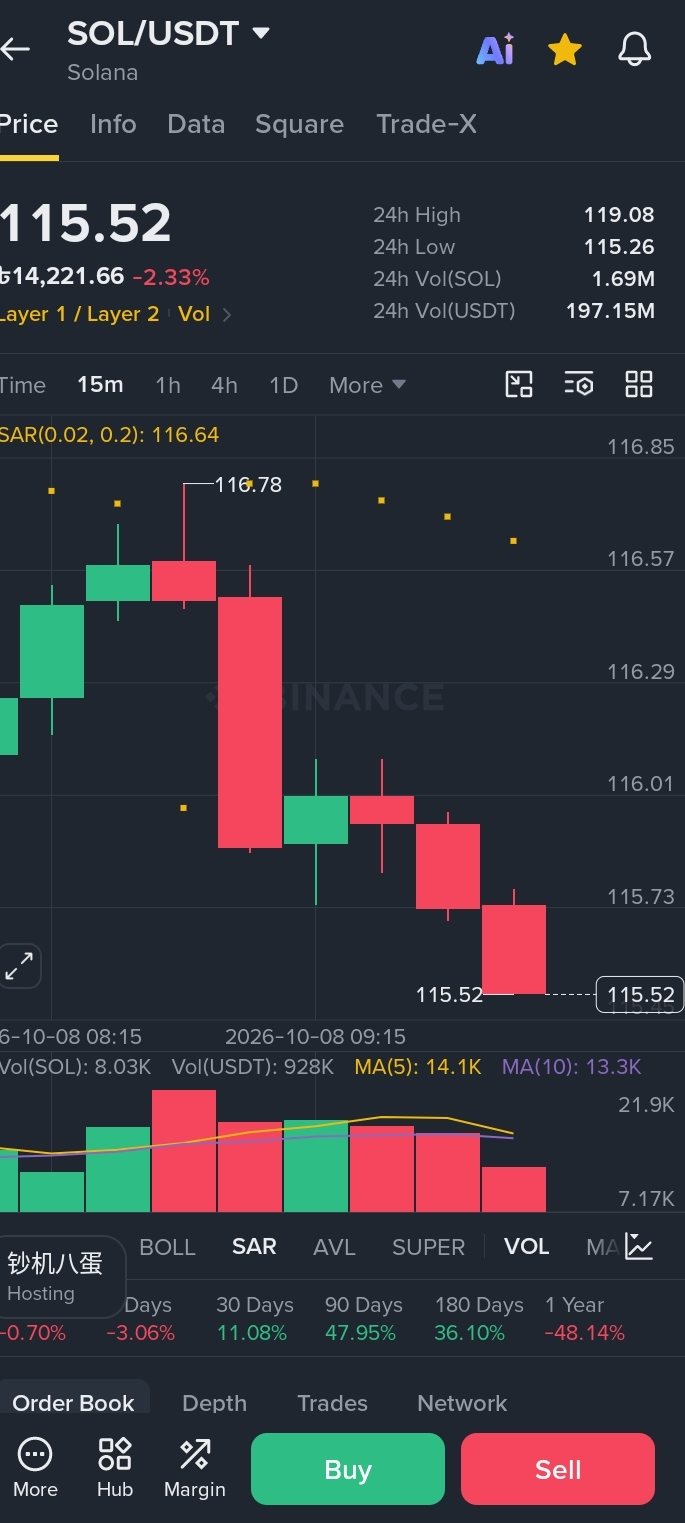
- *Price: $115.52 -2.33% (RED)* - SOL is down today.
- *24h High: 119.08 / Low: 115.26* - SOL touched $119 today, now it is at *almost the lowest point of the day* (115.52 vs 115.26 low). Very close to support.
- *24h Vol: 197.15M* - $197 Million volume.
*2. Candlestick Chart:*
- SOL went up to *116.78*, got rejected.
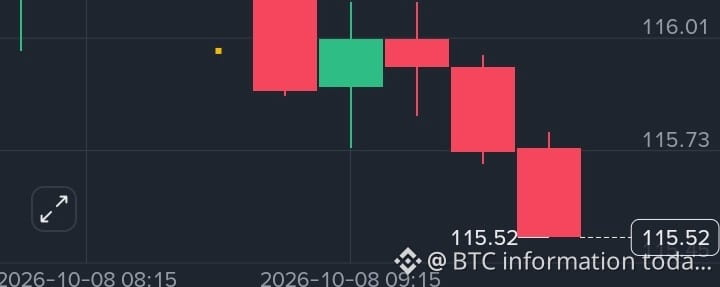
- Then a *very big red candle* - huge sell-off. That candle dropped the price from 116.50 to 115.80 in 15 minutes.
- After that, 3 more red candles down to *115.52*. Continuous selling.
*3. SAR (0.02, 0.2): 116.64*
- Yellow dots are *ABOVE the price at 116.64*.
- Above = *BEARISH*. Market is in short-term downtrend. The dots are far away, so the downtrend is strong.
*4. Bottom Indicators:*
- *Vol(SOL): 8.03K / Vol(USDT): 928K* - 8k SOL sold in last 15m.
- *MA(5): 14.1K / MA(10): 13.3K* - Price is *below both MA lines* (yellow & purple lines on volume). That confirms weakness.
*Simple Summary:*
> SOL is in a *strong short-term correction*. Rejected at 116.78, now at daily low 115.52. SAR is bearish. But this is near the 24h Low (115.26) - this is where many traders watch for a bounce.
If you want to post this:
> SOL Update - Testing Daily Low! $115.52 (-2.33%) 📉
> Rejected at $116.78, now at $115.52 near 24h Low of $115.26. SAR above price = bearish on 15m.
> Volume $197M shows interest is still high.
> Is SOL ready for a bounce from support? I'm watching, not panicking.