🚨 BITCOIN’S LONG-TERM TREND… IS HISTORY REPEATING? 👀
There’s something interesting about this Bitcoin chart.
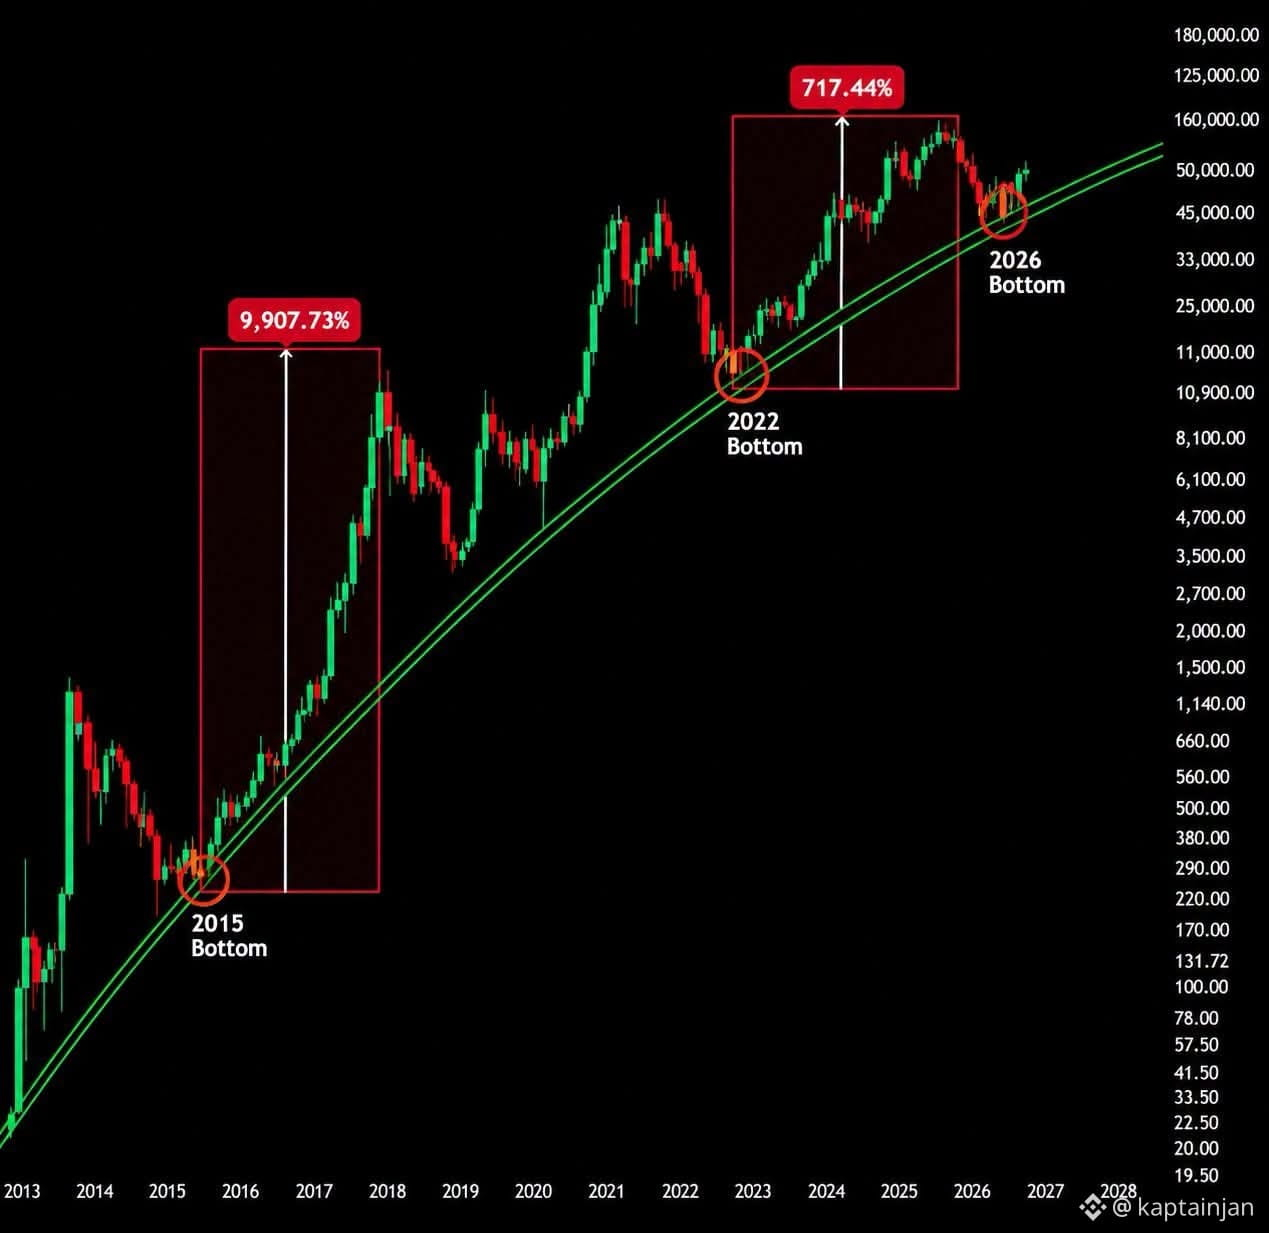
The 2015 bottom came after a major correction.
The 2022 bottom came after another major cycle decline.
And now, the 2026 price action is sitting right around the same long-term rising trend structure.
The previous cycles produced massive moves after touching this area:
2015 → +9,907%
2022 → +717%
Now the obvious question is:
Is this long-term trend actually telling us something…
or are we simply connecting historical bottoms and giving the pattern more meaning than it deserves?
Because there’s a big difference between saying:
“Bitcoin has reacted from this structure before”
and saying:
“Bitcoin MUST repeat the same move again.”
The first is historical data.
The second is a prediction.
So forget the percentage targets for a moment.
If Bitcoin continues respecting this long-term structure, what do you think the next major move could look like?
And if this trend finally breaks…
would that be the first real sign that Bitcoin’s historical cycle structure has changed?
I want to hear the chart traders on this one.
Do you see a valid long-term pattern here — or just coincidence? 👇
And if you think the pattern continues, what level are you watching next?
#Bitcoin❗
There’s something interesting about this Bitcoin chart.
The 2015 bottom came after a major correction.
The 2022 bottom came after another major cycle decline.
And now, the 2026 price action is sitting right around the same long-term rising trend structure.
The previous cycles produced massive moves after touching this area:
2015 → +9,907%
2022 → +717%
Now the obvious question is:
Is this long-term trend actually telling us something…
or are we simply connecting historical bottoms and giving the pattern more meaning than it deserves?
Because there’s a big difference between saying:
“Bitcoin has reacted from this structure before”
and saying:
“Bitcoin MUST repeat the same move again.”
The first is historical data.
The second is a prediction.
So forget the percentage targets for a moment.
If Bitcoin continues respecting this long-term structure, what do you think the next major move could look like?
And if this trend finally breaks…
would that be the first real sign that Bitcoin’s historical cycle structure has changed?
I want to hear the chart traders on this one.
Do you see a valid long-term pattern here — or just coincidence? 👇
And if you think the pattern continues, what level are you watching next?
#Bitcoin❗