


‼️ Listen guys the first thing I saw when I opened the chart was an RSI of 94.5. That number slaps you in the face. It doesn't whisper. It screams that the move already happened, and you're just late to the party
Contrast that with the other two. One is a beaten-down chart trying to breathe. The other is a slow bleed that nobody wants to talk about. Three different stories, all pointing to the same lesson
The tape doesn't lie. But it doesn't hand you the answer either
$US is the first one. The tape shows a bounce from 0.0100 to 0.0141, but the RSI at 80.8 tells you the recovery is stretched. Funding is neutral. Open interest is thin. There's no major headline here, just a relief bounce in a quiet market
The level that matters is $0.015. A clean break above it opens the door toward $0.018. Lose $0.0100 and the bid thins out
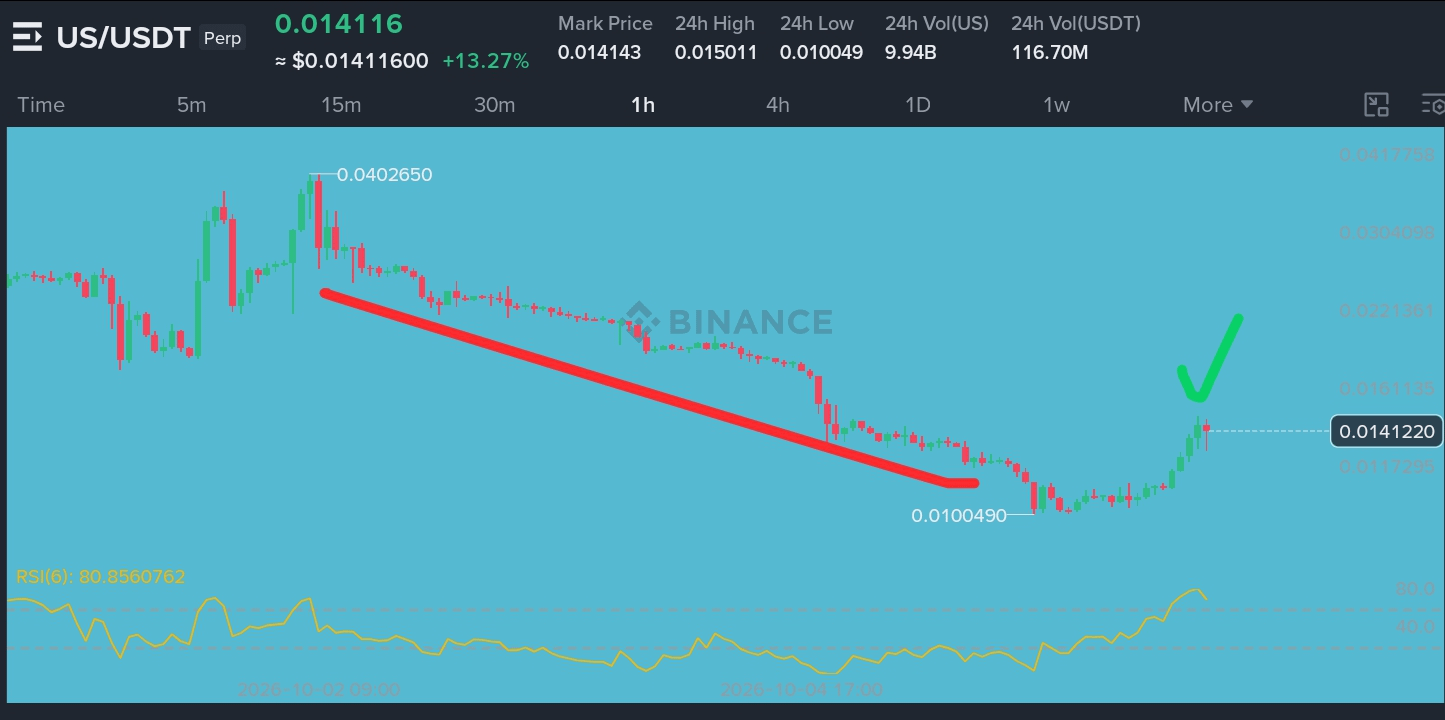
Above $0.015 and I'm watching $0.018 first, then $0.022. Lose $0.0100 and I'm done. I bought a dead cat bounce once, right at the top, and watched a 10% gain turn into a 20% loss while I waited for another leg up that never came
Trade here 👇🏽


$NMR is the second chart. Up 30% on the day, and the RSI is at 94.5. That's extreme. The headline is real: Upbit listing on October 6, both KRW and USDT pairs. That's a massive liquidity injection for a token with a $68 million market cap
Funding is positive at 0.0048% on KuCoin. Open interest sits around $14.43 million. That's not a crowded trade yet, but the RSI says the crowd is already here. The level that matters is $16.13. That's the recent high. A clean break above it opens the door toward $18. Lose $11.67 and the bid disappears
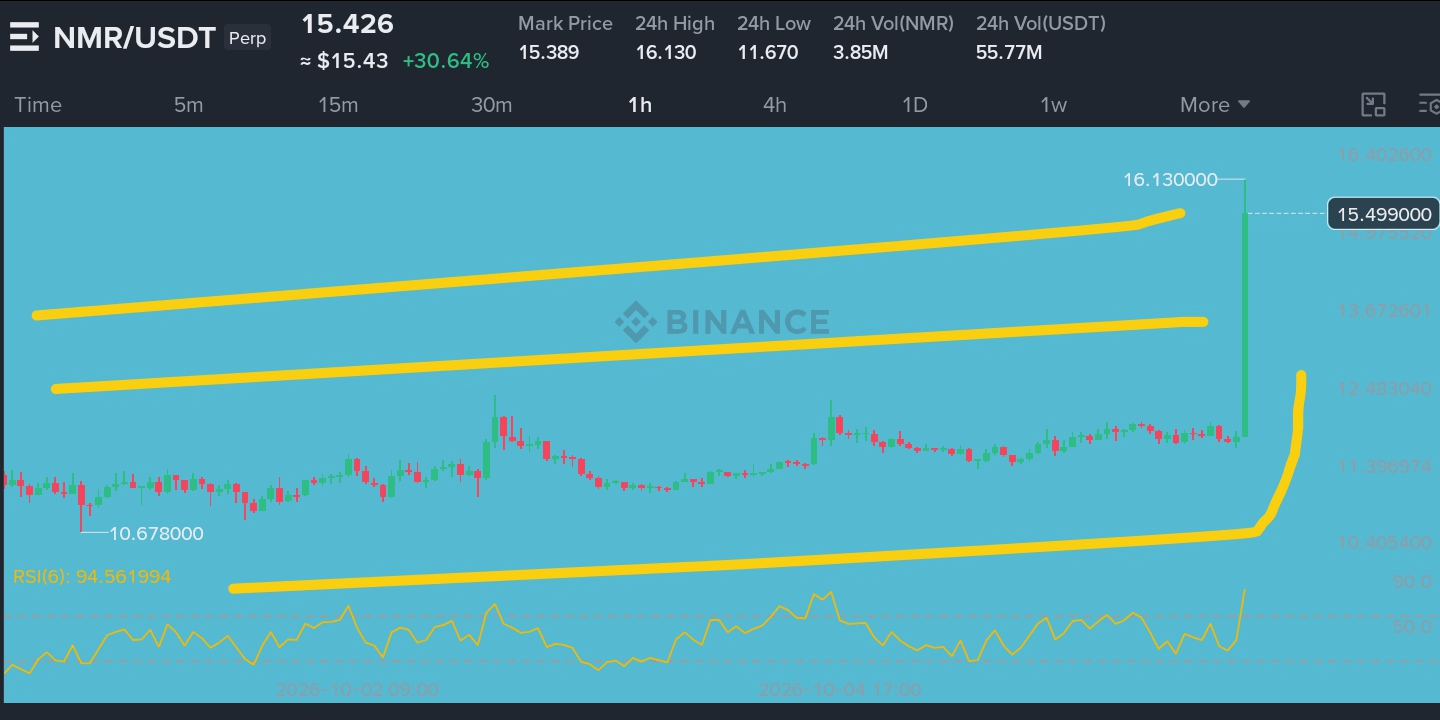
Above $16.13 and I'm watching $18 first, then $20. Lose $11.67 and I'm out
Trade here 👇🏽

$COLLECT is the third chart. This is the quietest of the three, but the funding rate tells a story. The average funding rate is 0.0602%. Longs are paying shorts nearly six-hundredths of a percent. That's the market leaning one way, hard
The headline is the Binance Alpha trading competition back in September and the perpetual futures listing. That's a liquidity event, not a product launch. Open interest sits around $8.98 million. The level that matters is $0.0274. That's the high from the recent spike. A clean break above it opens the door toward $0.030. Lose $0.0208 and the bid thins out
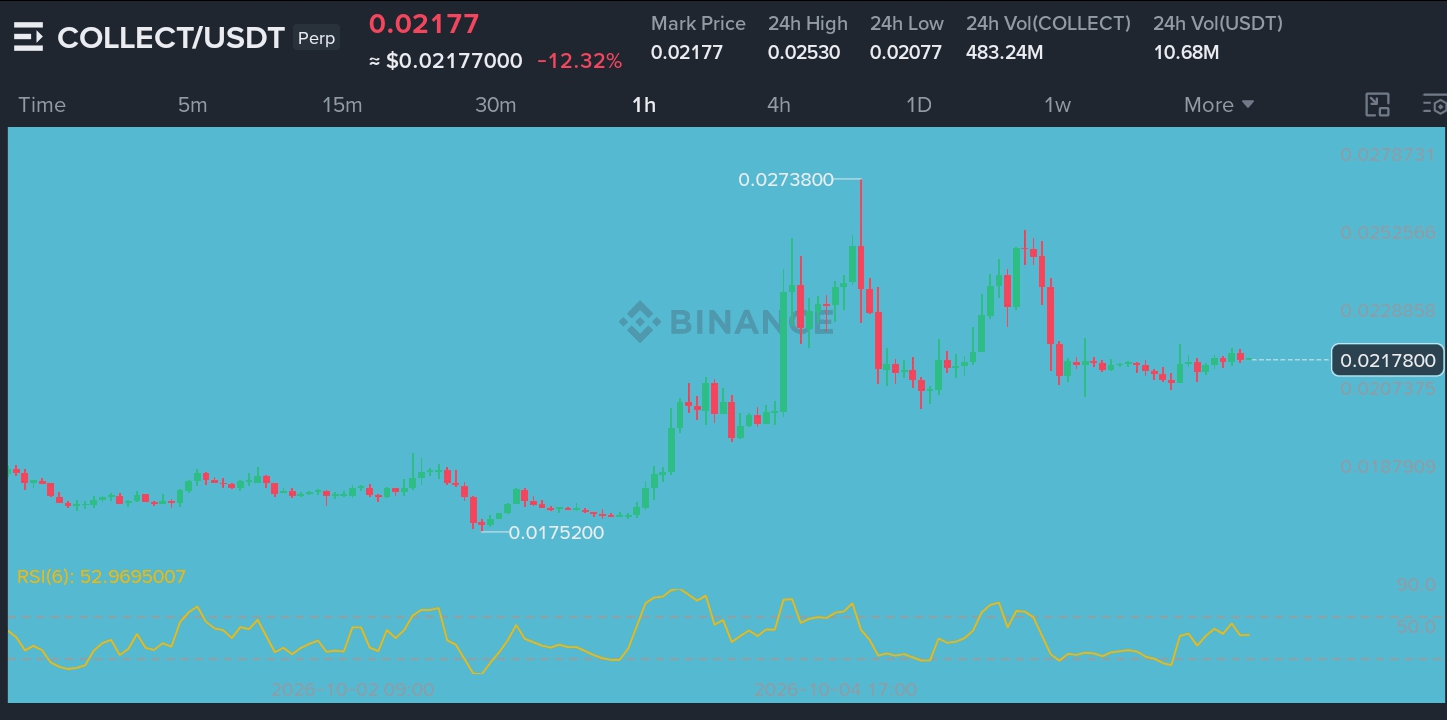
Above $0.0274 and I'm watching $0.030 first, then $0.035. Lose $0.0208 and I'm out
Trade here 👇🏽


The wider market matters here. Bitcoin is holding near $85,559 after tapping $87,000. Dominance slipped to 58.7% as of October 6, down from nearly 60% a week ago. That's the spine of this whole trade
When dominance falls while the aggregate cap rises, the marginal dollar is moving down the risk curve. The Altcoin Season Index is at 64 out of 100. Still below the 75 threshold that confirms a full rotation, but the direction is clear
Open interest in perpetual futures across crypto is elevated. The crowd is leaning into these listings and the meme plays. Where I could be wrong is if Bitcoin dominance reclaims 60% and the rotation stalls. Then the late longs get paid and these breakouts fail
I've been on the wrong side of a "confirmed breakout" before. The chart looked perfect, every box checked, and then the bid vanished. That's why I don't trust a wick at the high
The levels are the levels. The tape will tell you which ones matter
Are you trading the chart in front of you, or the story you want to believe?
#BinanceLaunchesBinanceIntelligence #EvernorthXRPTreasuryCompletesSPACMerger #ETHUp70%InQ3ButLiquidityFalls #DriftHackVictimsBeginClaims #FedOctoberHoldOdds82.3%