
**📉 $CYS
/ USD Technical Breakdown: Is the Bottom In After a Heavy Correction? 🚨**
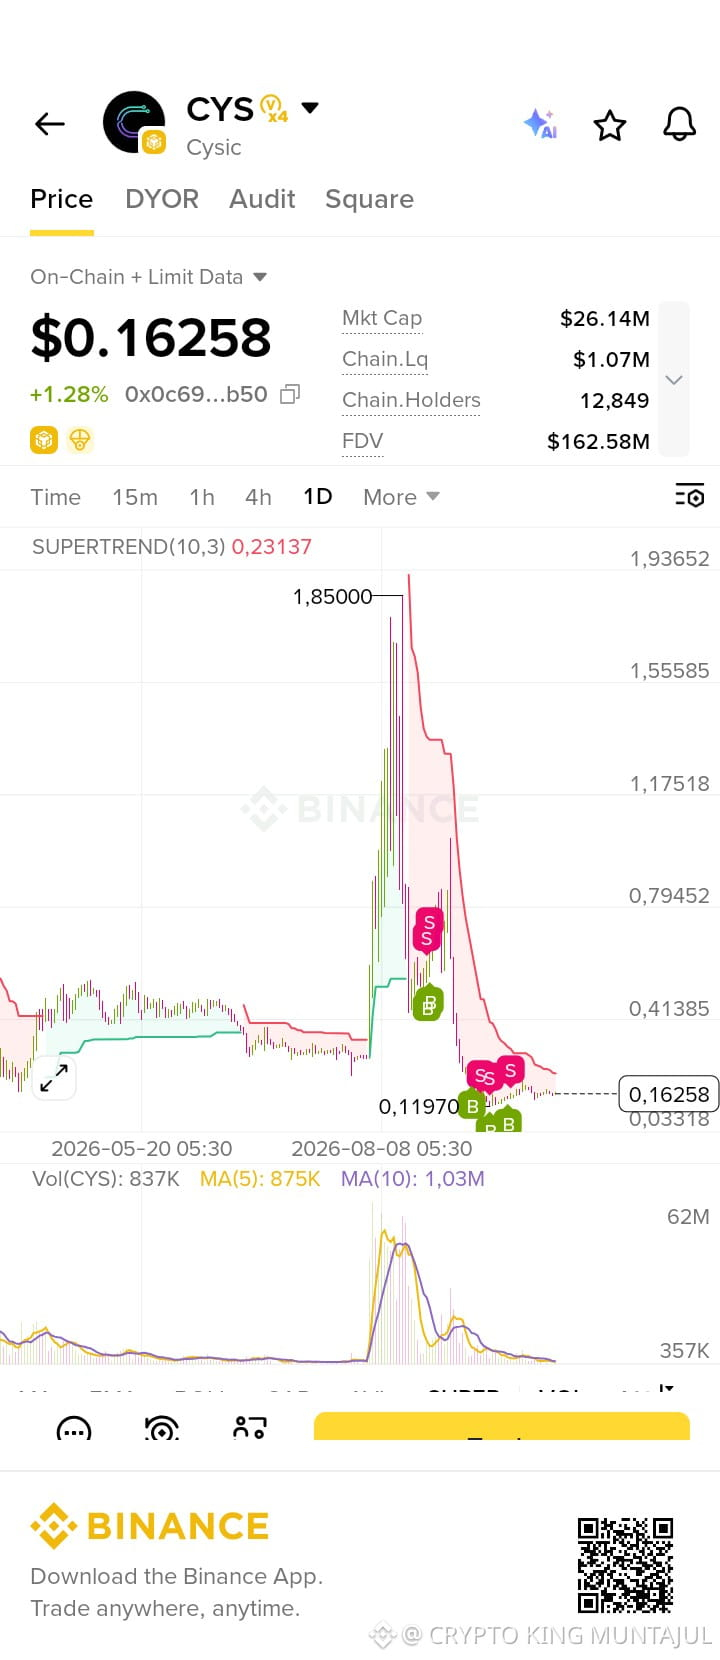
The daily chart for **$CYS (Cysic)** shows a classic boom-and-bust cycle followed by a tight consolidation phase near key support. Here is a breakdown of the key levels and technical indicators:
### **1. On-Chain Metrics & Key Levels**
* **Current Price:** ~$0.16258 (+1.28% 24h)
* **Market Cap:** $26.14M
* **FDV:** $162.58M
* **Chain Liquidity:** $1.07M
* **Holders:** 12,849
* **Recent High:** ~$1.8500
* **Recent Low (Support Floor):** ~$0.11970
* **Supertrend Resistance:** $0.23137
### **2. Technical Analysis**
* **Massive Drawdown:** Following an explosive rally toward the **$1.85** mark, $CYS faced intense selling pressure, dropping nearly 90% to establish a swing low around **$0.1197**.
* **Volume Drying Up:** The volume spike during the peak has significantly diminished, pointing to reduced selling pressure and potential market stabilization.
* **Trading Range Base:** The asset is now moving sideways between **$0.12** and **$0.23**, forming a compression channel where buy and sell signals are clustering near current levels.
### **3. Strategic Outlook**
* 🟢 **Bullish Scenario:** A breakout above the Supertrend resistance at **$0.231** with volume confirmation could spark a relief rally toward the **$0.41** overhead level.
* 🔴 **Bearish Scenario:** A breakdown below the **$0.119** local support floor may lead to further downside price discovery.
💬 **What is your move on $CYS? Accumulating during consolidation or waiting for a breakout above $0.23? Drop your thoughts below!** 👇
#Cys #Cysic #cryptotrading #BinanceSquare #TechnicalAnalysis #Altcoins
/ USD Technical Breakdown: Is the Bottom In After a Heavy Correction? 🚨**
The daily chart for **$CYS (Cysic)** shows a classic boom-and-bust cycle followed by a tight consolidation phase near key support. Here is a breakdown of the key levels and technical indicators:
### **1. On-Chain Metrics & Key Levels**
* **Current Price:** ~$0.16258 (+1.28% 24h)
* **Market Cap:** $26.14M
* **FDV:** $162.58M
* **Chain Liquidity:** $1.07M
* **Holders:** 12,849
* **Recent High:** ~$1.8500
* **Recent Low (Support Floor):** ~$0.11970
* **Supertrend Resistance:** $0.23137
### **2. Technical Analysis**
* **Massive Drawdown:** Following an explosive rally toward the **$1.85** mark, $CYS faced intense selling pressure, dropping nearly 90% to establish a swing low around **$0.1197**.
* **Volume Drying Up:** The volume spike during the peak has significantly diminished, pointing to reduced selling pressure and potential market stabilization.
* **Trading Range Base:** The asset is now moving sideways between **$0.12** and **$0.23**, forming a compression channel where buy and sell signals are clustering near current levels.
### **3. Strategic Outlook**
* 🟢 **Bullish Scenario:** A breakout above the Supertrend resistance at **$0.231** with volume confirmation could spark a relief rally toward the **$0.41** overhead level.
* 🔴 **Bearish Scenario:** A breakdown below the **$0.119** local support floor may lead to further downside price discovery.
💬 **What is your move on $CYS? Accumulating during consolidation or waiting for a breakout above $0.23? Drop your thoughts below!** 👇
#Cys #Cysic #cryptotrading #BinanceSquare #TechnicalAnalysis #Altcoins