
**📉 $GUA
/ USD Short Technical Analysis: Macro Downtrend or Bottoming Out? 🚨**
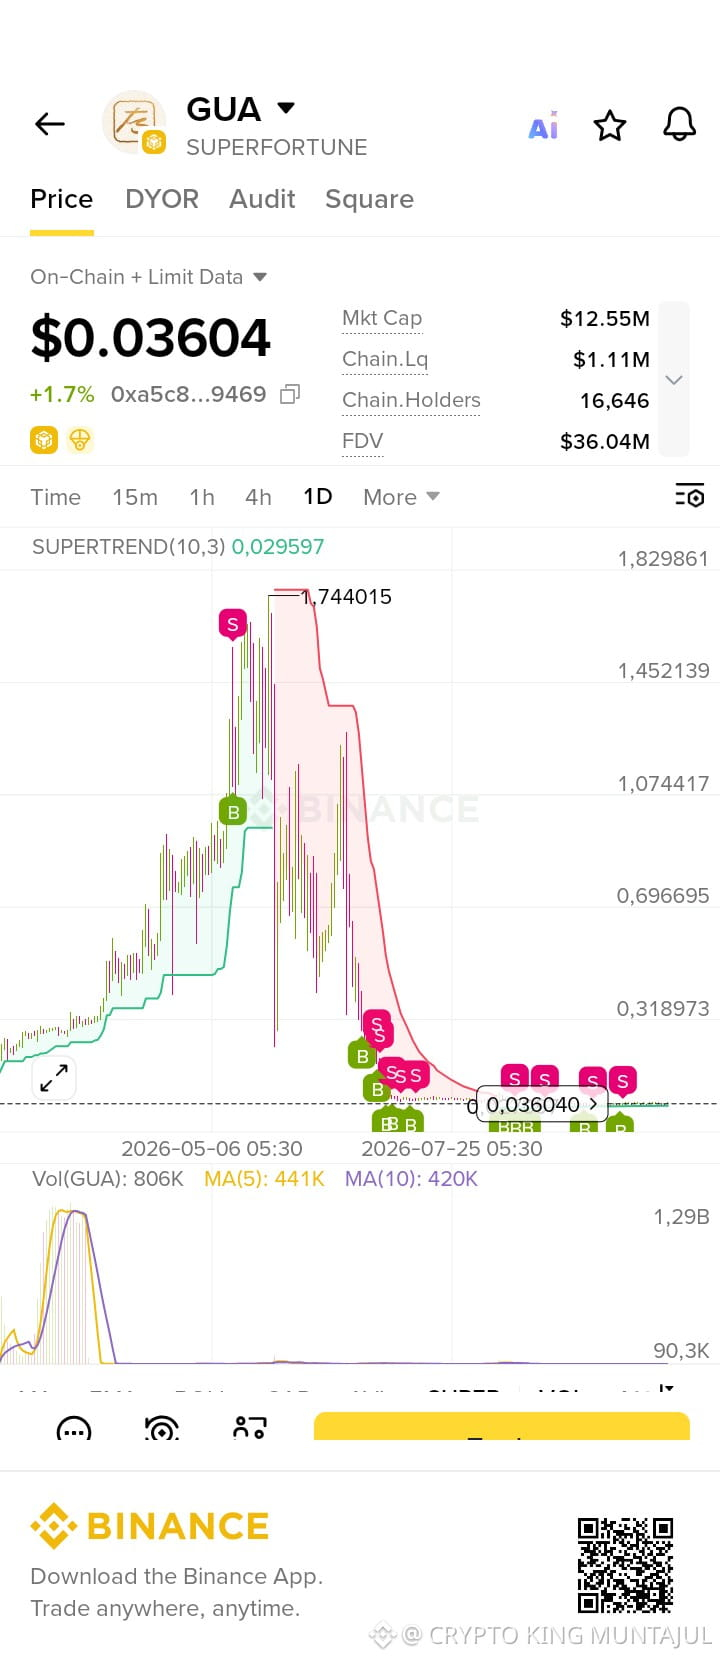
The chart for **$GUA (SuperFortune)** on the 1D timeframe displays severe downside volatility following its historic peak. Here is a breakdown of key technical levels and indicators visible on the chart:
### **1. Key Metrics & Price Levels**
* **Current Price:** ~$0.03604 (+1.7% 24h)
* **Market Cap:** $12.55M
* **FDV:** $36.04M
* **Chain Liquidity:** $1.11M
* **Historical All-Time High:** ~$1.744
* **Supertrend Resistance Zone:** $0.02959 – $0.0360
### **2. Technical Analysis**
* **Massive Correction:** After hitting its local top around **$1.744**,$GUA experienced a strong parabolic breakdown.
* **Compression & Consolidation:** The price is currently oscillating at the bottom around the **$0.030 – $0.036** area.
* **Indicator Signals:** The daily chart shows multiple automated buy/sell signals clustered near the current support floor, indicating heavy accumulation vs. distribution battles at these lower bounds.
* **Volume Profile:** Daily volume has dropped significantly compared to the explosive movement during its peak, signaling market exhaustion and potential price base formation.
### **3. Strategic Outlook**
* 🟢 **Bullish Scenario:** A sustained daily close above the **$0.036 – $0.040** resistance cluster could confirm a double-bottom reversal, paving the way for a relief rally.
* 🔴 **Bearish Scenario:** Losing the **$0.029** Supertrend support level may trigger further price discovery on the downside.
💬 **What's your strategy on $GUA? Are you accumulating at these levels, or waiting for a confirmed trend shift? Let us know in the comments below!** 👇
#GUA #SuperFortune #cryptotrading #BinanceSquare #TechnicalAnalysis #Write2Earn
/ USD Short Technical Analysis: Macro Downtrend or Bottoming Out? 🚨**
The chart for **$GUA (SuperFortune)** on the 1D timeframe displays severe downside volatility following its historic peak. Here is a breakdown of key technical levels and indicators visible on the chart:
### **1. Key Metrics & Price Levels**
* **Current Price:** ~$0.03604 (+1.7% 24h)
* **Market Cap:** $12.55M
* **FDV:** $36.04M
* **Chain Liquidity:** $1.11M
* **Historical All-Time High:** ~$1.744
* **Supertrend Resistance Zone:** $0.02959 – $0.0360
### **2. Technical Analysis**
* **Massive Correction:** After hitting its local top around **$1.744**,$GUA experienced a strong parabolic breakdown.
* **Compression & Consolidation:** The price is currently oscillating at the bottom around the **$0.030 – $0.036** area.
* **Indicator Signals:** The daily chart shows multiple automated buy/sell signals clustered near the current support floor, indicating heavy accumulation vs. distribution battles at these lower bounds.
* **Volume Profile:** Daily volume has dropped significantly compared to the explosive movement during its peak, signaling market exhaustion and potential price base formation.
### **3. Strategic Outlook**
* 🟢 **Bullish Scenario:** A sustained daily close above the **$0.036 – $0.040** resistance cluster could confirm a double-bottom reversal, paving the way for a relief rally.
* 🔴 **Bearish Scenario:** Losing the **$0.029** Supertrend support level may trigger further price discovery on the downside.
💬 **What's your strategy on $GUA? Are you accumulating at these levels, or waiting for a confirmed trend shift? Let us know in the comments below!** 👇
#GUA #SuperFortune #cryptotrading #BinanceSquare #TechnicalAnalysis #Write2Earn