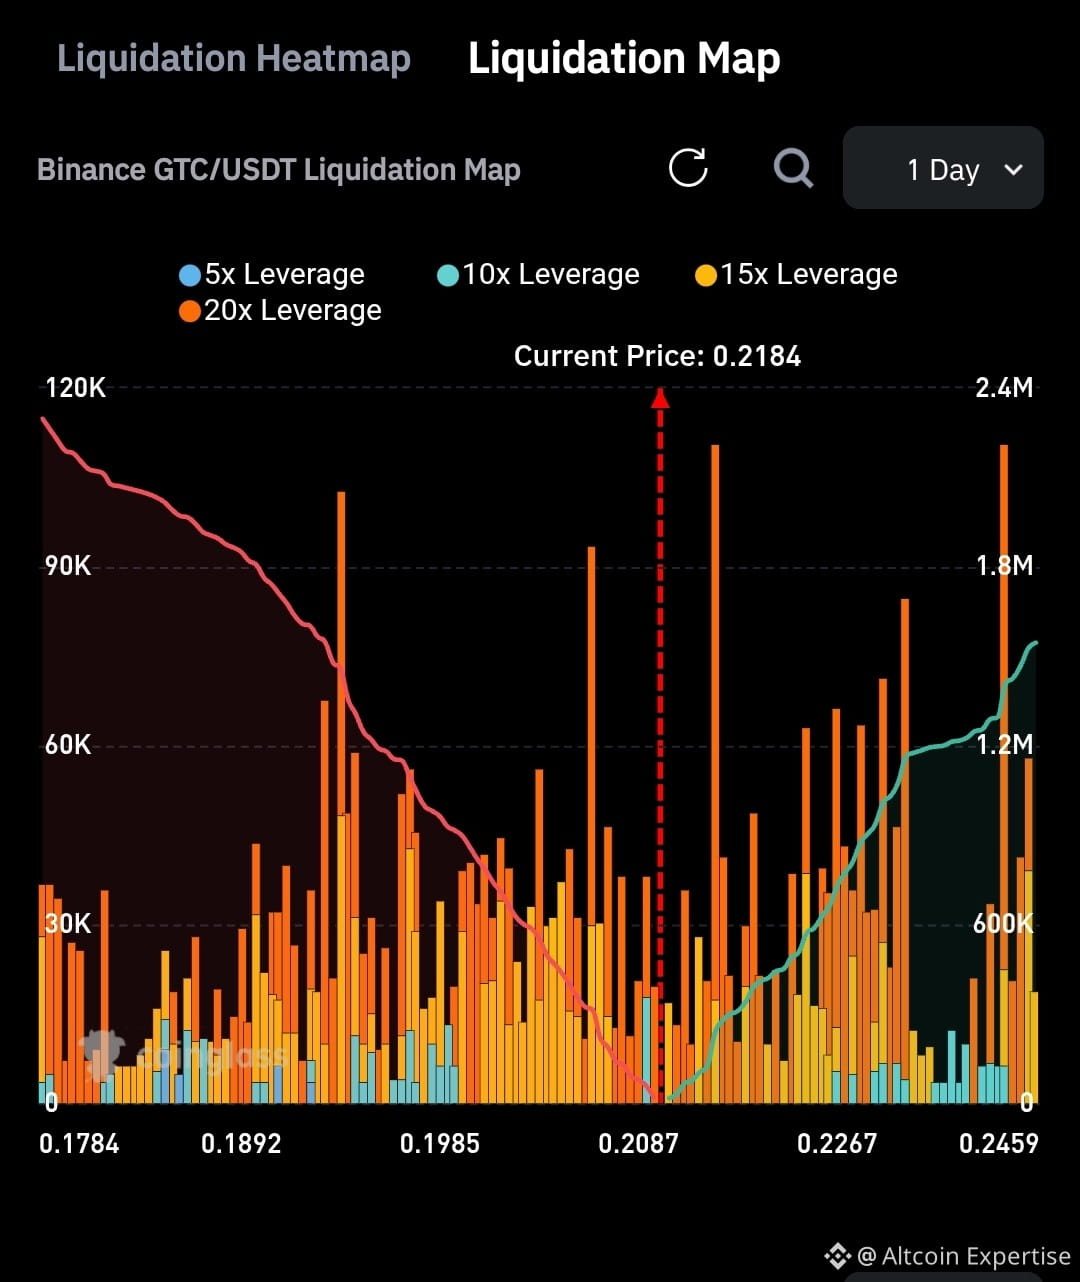
$GTC As funding rates dip into negative territory, the liquidation map is setting a major trap at the 0.2184 level!
The 1-day liquidation map shows a concentration of long and short positions with 15x–20x leverage in the 0.20–0.23 range.
While the current price hovers at 0.2184, orange-yellow bars in the 0.2267–0.2459 range on the upside are drawing attention.
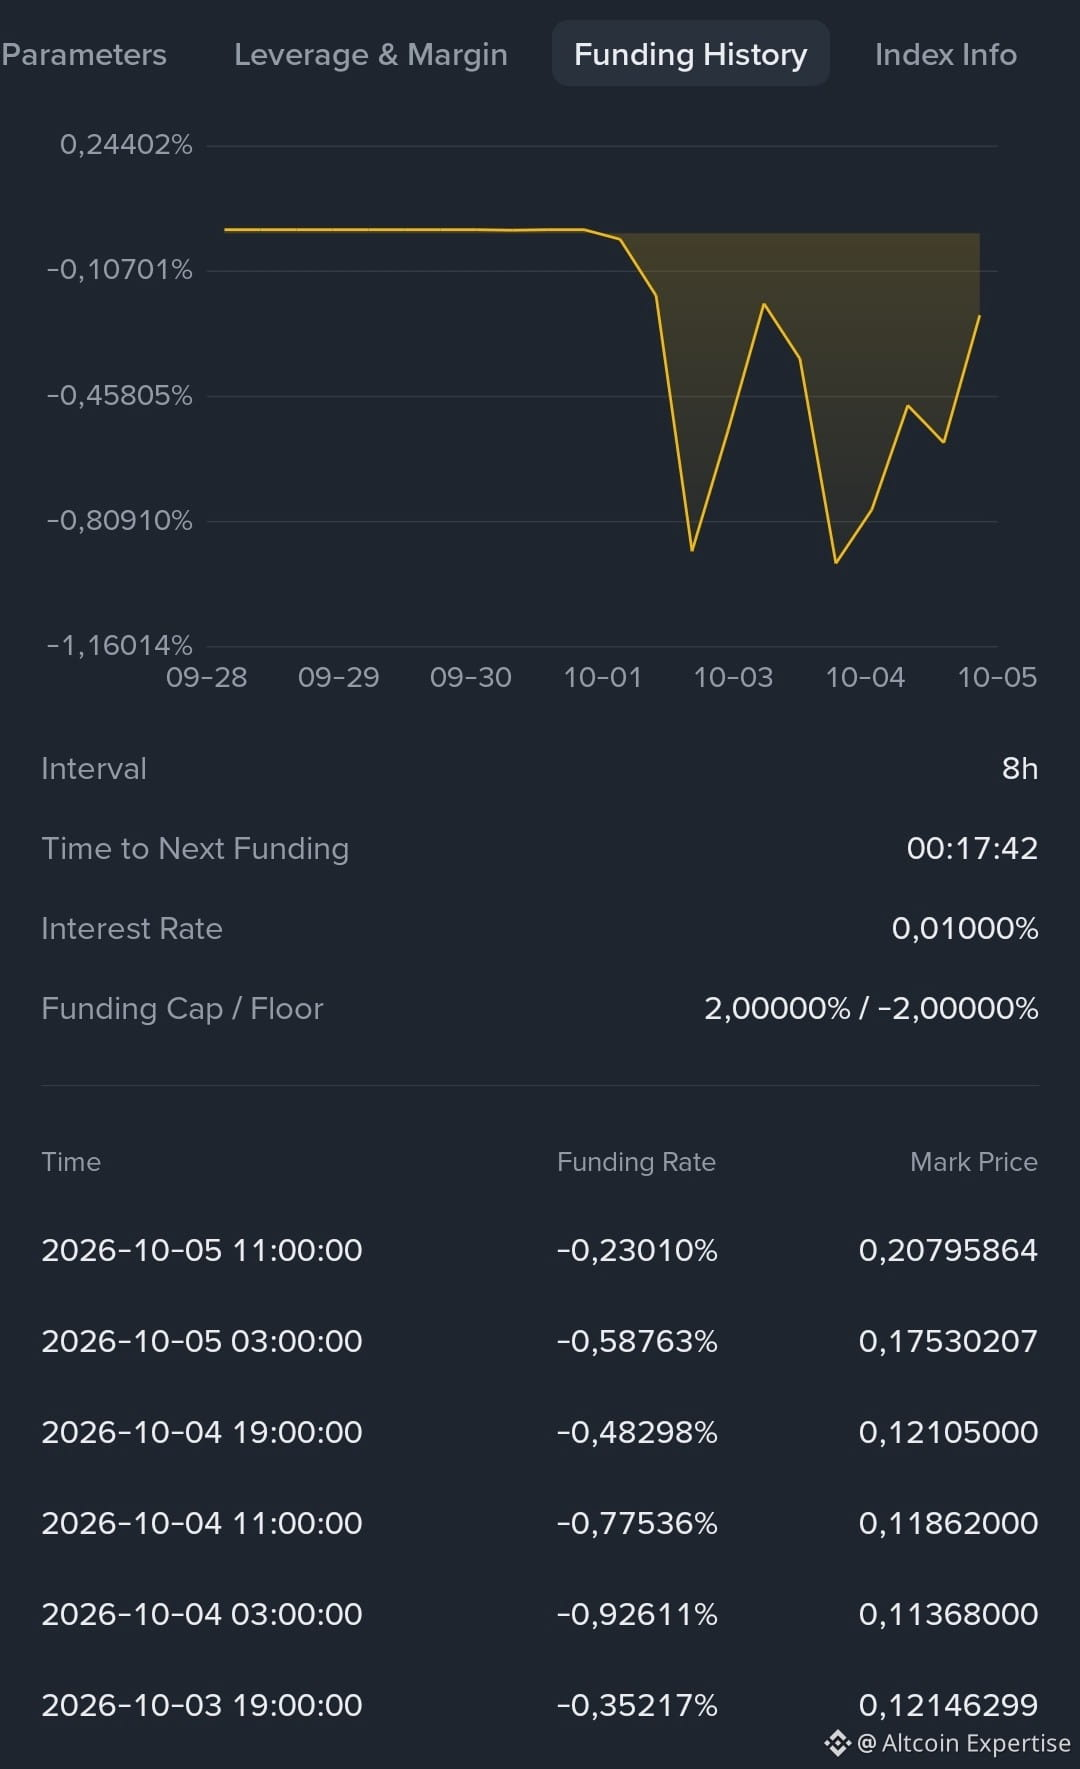
The funding rate has been negative, ranging from -0.23% to -0.92% over the past 8 hours; this indicates that shorts are dominant but that short positions could melt away in the event of a sudden spike.
Below 0.2087 and above 0.23 are critical thresholds. Volatility is on the horizon for highly leveraged traders. Monitor closely.
#GTCUSDT #crypto #bullish #long #bearish
The 1-day liquidation map shows a concentration of long and short positions with 15x–20x leverage in the 0.20–0.23 range.
While the current price hovers at 0.2184, orange-yellow bars in the 0.2267–0.2459 range on the upside are drawing attention.
The funding rate has been negative, ranging from -0.23% to -0.92% over the past 8 hours; this indicates that shorts are dominant but that short positions could melt away in the event of a sudden spike.
Below 0.2087 and above 0.23 are critical thresholds. Volatility is on the horizon for highly leveraged traders. Monitor closely.
#GTCUSDT #crypto #bullish #long #bearish