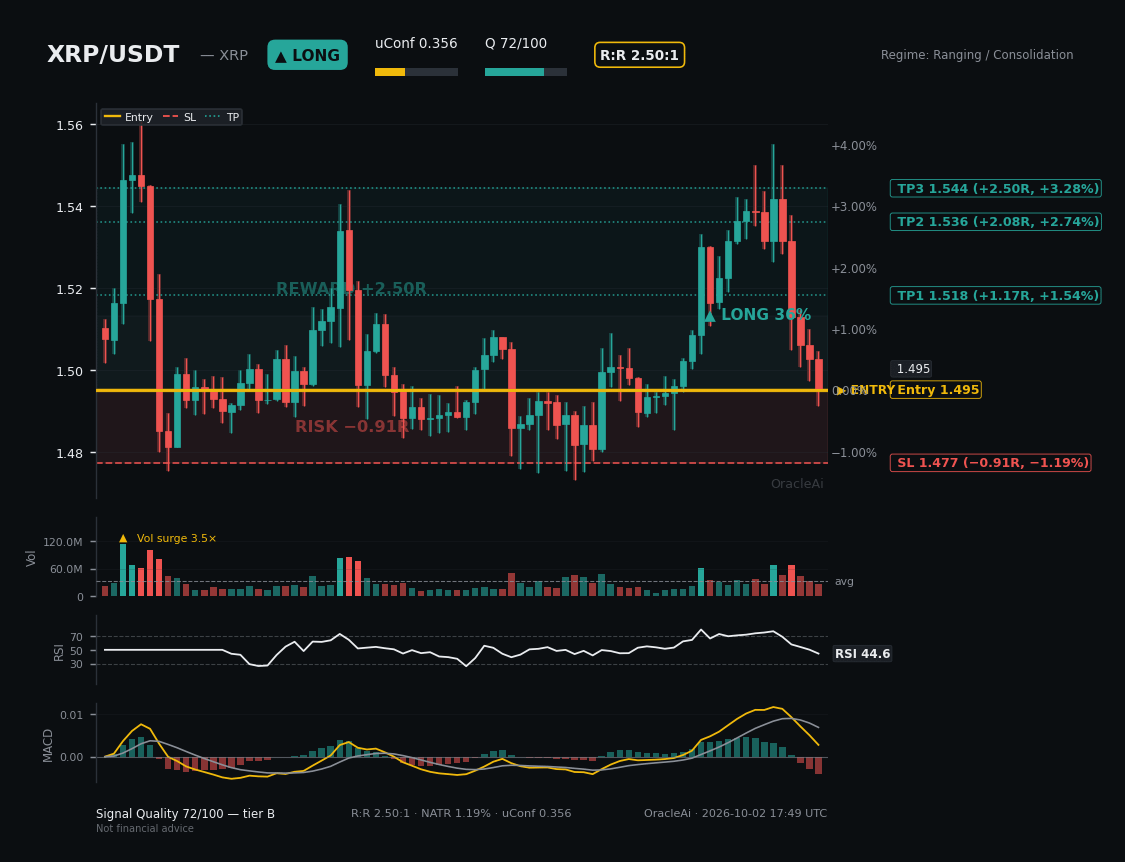
XRP Setup Call vs. Reality: Precision Timing on the October 2 Flush
Can a model successfully map a local market bottom before the candle closes?
On October 2 at 10:49 PM, our system flagged an institutional-grade LONG setup on XRP/USDT while the market was under pressure.
Here is how the parameters stacked up against the live chart:
🎯 Entry Zone: $1.50 reference ($1.4458 local sweep defended)
🛑 Risk Control: $1.48 strict stop-loss
📈 Targets: Tiered scaling up to $1.54 (R:R 2.50:1, Quality Score 72/100)
Instead of chasing green candles after the bounce, the automated engine calculated the probabilities, weighed the risk-to-reward ratio, and locked in the setup ahead of time.
Check out the side-by-side comparison below to see how the model's projection matched the subsequent price action. How do you usually filter out fakeouts during high-volatility sweeps?
#xrp #XRPUSDT #BinanceSquare #cryptotrading #AlgoTrading #RangeTrading
Can a model successfully map a local market bottom before the candle closes?
On October 2 at 10:49 PM, our system flagged an institutional-grade LONG setup on XRP/USDT while the market was under pressure.
Here is how the parameters stacked up against the live chart:
🎯 Entry Zone: $1.50 reference ($1.4458 local sweep defended)
🛑 Risk Control: $1.48 strict stop-loss
📈 Targets: Tiered scaling up to $1.54 (R:R 2.50:1, Quality Score 72/100)
Instead of chasing green candles after the bounce, the automated engine calculated the probabilities, weighed the risk-to-reward ratio, and locked in the setup ahead of time.
Check out the side-by-side comparison below to see how the model's projection matched the subsequent price action. How do you usually filter out fakeouts during high-volatility sweeps?
#xrp #XRPUSDT #BinanceSquare #cryptotrading #AlgoTrading #RangeTrading