📊 ALICE/USDT Trading Analysis
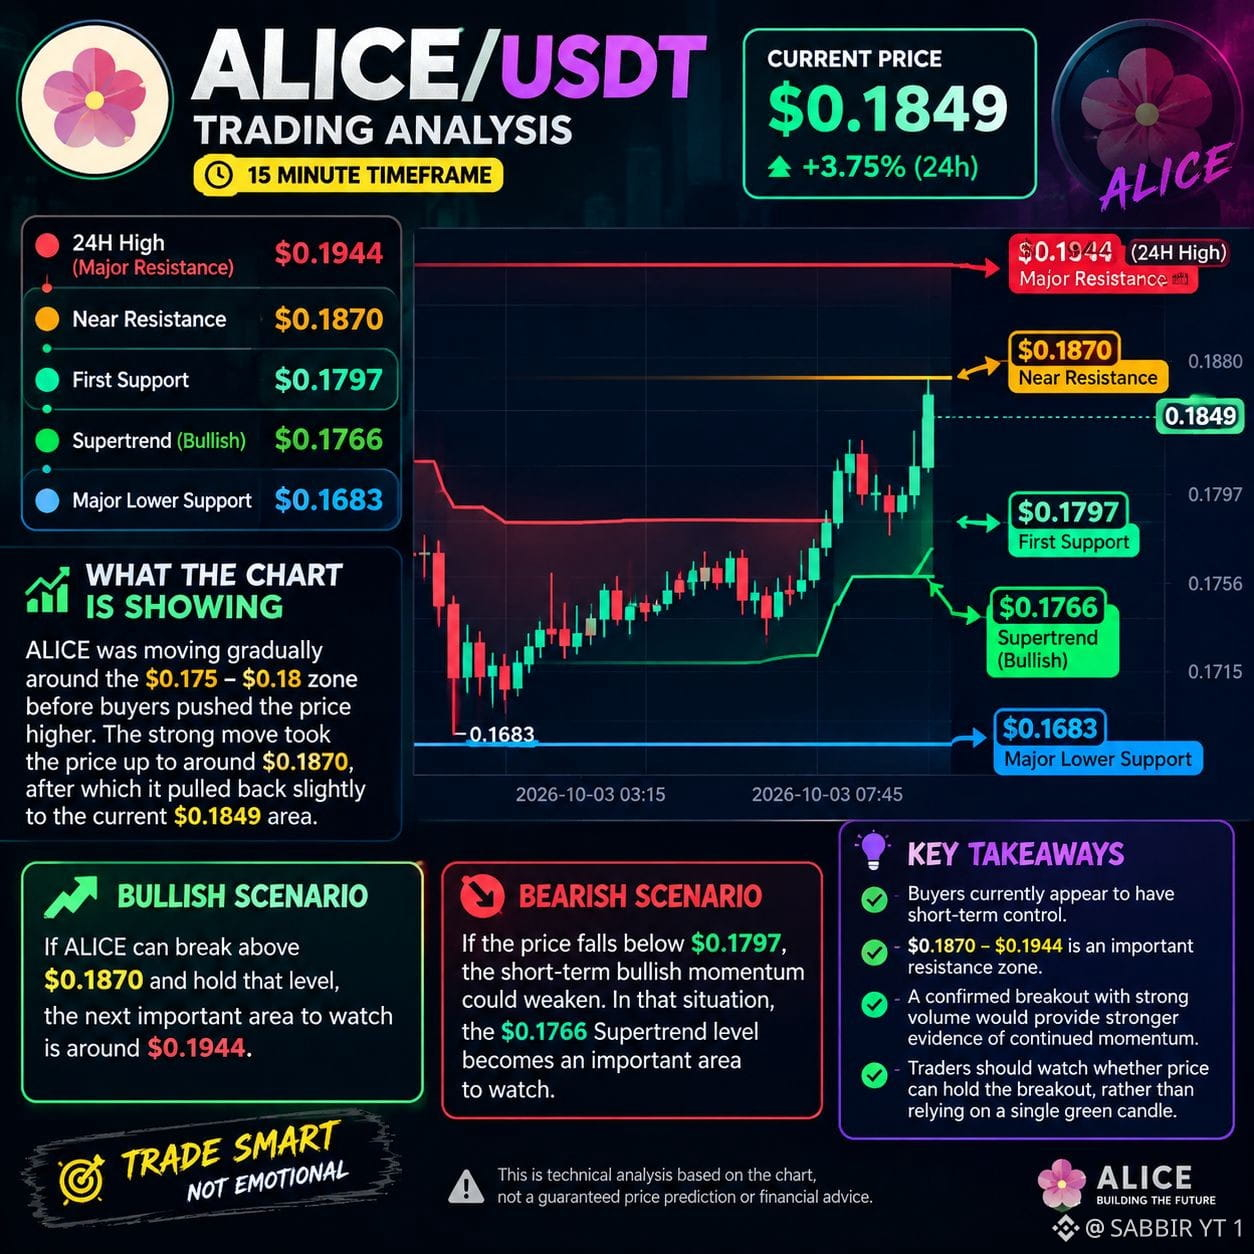
This chart shows ALICE/USDT on the 15-minute timeframe. The price is currently around $0.1849, and recent candles indicate that buyers have gained short-term momentum.
🟢 Current Price: $0.1849
🔼 Near Resistance: $0.1870
🔥 Major Resistance: $0.1944 — 24H High
🟡 First Support: $0.1797
🟢 Supertrend: $0.1766 — currently bullish on the 15m chart
🔻 Major Lower Support: $0.1683
🔎 What the Chart Is Showing
ALICE was moving gradually around the $0.175–$0.18 zone before buyers pushed the price higher. The strong move took the price up to around $0.1870, after which it pulled back slightly to the current $0.1849 area.
If ALICE can break above $0.1870 and hold that level, the next important area to watch is around $0.1944.
On the other hand, if the price falls below $0.1797, the short-term bullish momentum could weaken. In that situation, the $0.1766 Supertrend level becomes an important area to watch.
In simple terms:
👉 Buyers currently appear to have short-term control, but $0.1870–$0.1944 is an important resistance zone. A confirmed breakout with strong volume would provide stronger evidence of continued momentum. Traders should also watch whether price can hold the breakout rather than relying on a single green candle.
⚠️ This is technical analysis based on the chart, not a guaranteed price prediction or financial advice.
#SECProposesCryptoCustodyRules
#SECApproves3xLongCryptoCommodityETPs
#CerebrasSinksNearly20%OnReportNvidiaToPowerOpenAI
This chart shows ALICE/USDT on the 15-minute timeframe. The price is currently around $0.1849, and recent candles indicate that buyers have gained short-term momentum.
🟢 Current Price: $0.1849
🔼 Near Resistance: $0.1870
🔥 Major Resistance: $0.1944 — 24H High
🟡 First Support: $0.1797
🟢 Supertrend: $0.1766 — currently bullish on the 15m chart
🔻 Major Lower Support: $0.1683
🔎 What the Chart Is Showing
ALICE was moving gradually around the $0.175–$0.18 zone before buyers pushed the price higher. The strong move took the price up to around $0.1870, after which it pulled back slightly to the current $0.1849 area.
If ALICE can break above $0.1870 and hold that level, the next important area to watch is around $0.1944.
On the other hand, if the price falls below $0.1797, the short-term bullish momentum could weaken. In that situation, the $0.1766 Supertrend level becomes an important area to watch.
In simple terms:
👉 Buyers currently appear to have short-term control, but $0.1870–$0.1944 is an important resistance zone. A confirmed breakout with strong volume would provide stronger evidence of continued momentum. Traders should also watch whether price can hold the breakout rather than relying on a single green candle.
⚠️ This is technical analysis based on the chart, not a guaranteed price prediction or financial advice.
#SECProposesCryptoCustodyRules
#SECApproves3xLongCryptoCommodityETPs
#CerebrasSinksNearly20%OnReportNvidiaToPowerOpenAI