$ZEC Technical Research 📊
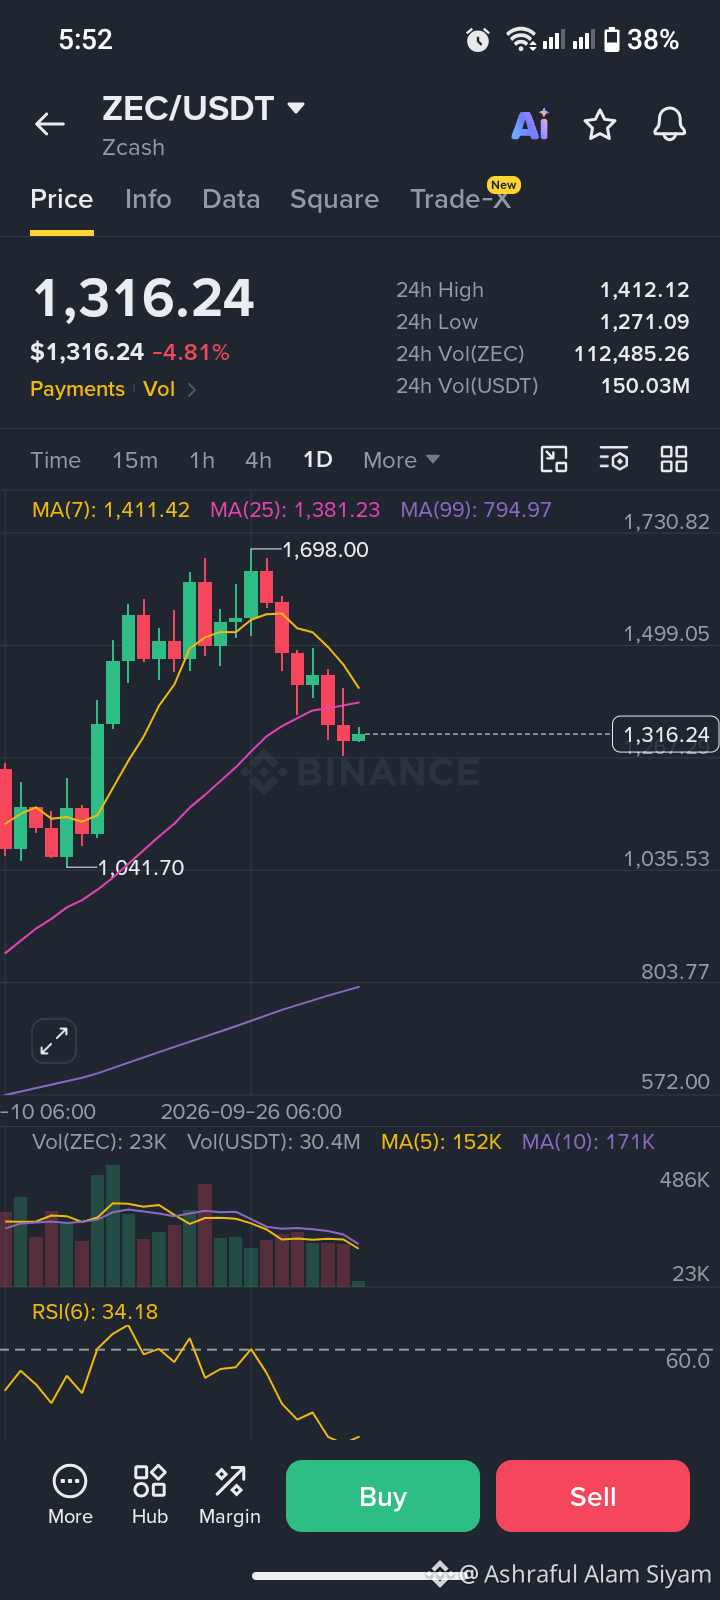
ZEC/USDT is showing a clear short-term correction on the 1D chart.
Current price: $1,316
24H Low: $1,271
24H High: $1,412
🔹 Trend: Price is trading below both MA(7) $1,411 and MA(25) $1,381, suggesting short-term bearish pressure.
🔹 RSI: 34.18 — momentum is weak and approaching oversold territory, but a reversal is not confirmed yet.
🔹 Key Support: $1,270–$1,300
🔹 Major Resistance: $1,380–$1,412
🔹 Bullish Scenario: A strong daily close above $1,412 could improve the structure and open the way toward higher levels.
🔹 Bearish Scenario: Losing $1,270 could bring another wave of selling.
My view: ZEC is at an important decision zone. I’d watch the $1,270 support and RSI reaction before assuming the next major move.
Not financial advice — always manage risk. DYOR. 🔍
#ZEC #Crypto
ZEC/USDT is showing a clear short-term correction on the 1D chart.
Current price: $1,316
24H Low: $1,271
24H High: $1,412
🔹 Trend: Price is trading below both MA(7) $1,411 and MA(25) $1,381, suggesting short-term bearish pressure.
🔹 RSI: 34.18 — momentum is weak and approaching oversold territory, but a reversal is not confirmed yet.
🔹 Key Support: $1,270–$1,300
🔹 Major Resistance: $1,380–$1,412
🔹 Bullish Scenario: A strong daily close above $1,412 could improve the structure and open the way toward higher levels.
🔹 Bearish Scenario: Losing $1,270 could bring another wave of selling.
My view: ZEC is at an important decision zone. I’d watch the $1,270 support and RSI reaction before assuming the next major move.
Not financial advice — always manage risk. DYOR. 🔍
#ZEC #Crypto