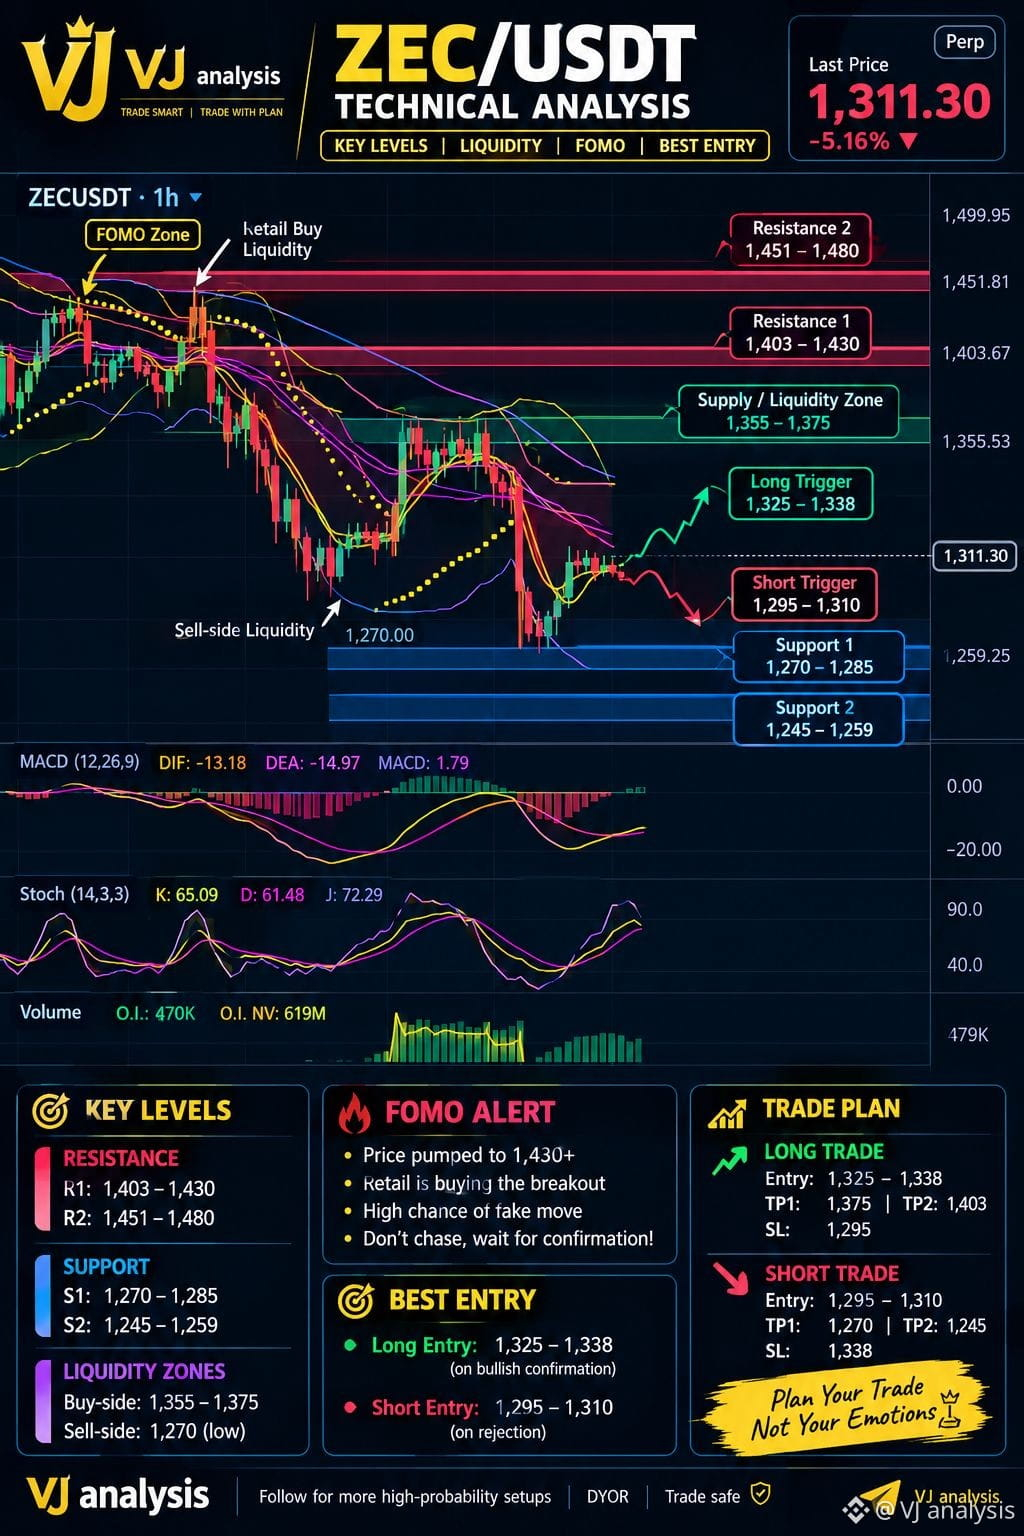
🔥 #ZECUSDT # — 1H TECHNICAL ANALYSIS
⚡ VJ ANALYSIS | FOMO + LIQUIDITY SETUP
📌 Current Price: 1,311.30
📉 24H Change: -5.16%
📍 24H High: 1,413
📍 24H Low: 1,270
━━━━━━━━━━━━━━━
🎯 KEY MARKET LEVELS
━━━━━━━━━━━━━━━
🔴 Resistance 1: 1,403–1,430
🔴 Resistance 2: 1,451–1,480
🟢 Supply / Liquidity: 1,355–1,375
🔵 Support 1: 1,270–1,285
🔵 Support 2: 1,245–1,259
💧 Sell-Side Liquidity: Around 1,270
💧 Buy-Side Liquidity: 1,355–1,375
📊 ZEC is trading around 1,311 after a sharp decline from the 1,400+ area and a sweep toward the 1,270 low. The current bounce shows some recovery, but price remains below major moving-average resistance and the broader 1H structure is still under pressure.
🔥 FOMO ALERT:
A sudden move toward 1,355–1,375 could attract late buyers. Avoid chasing a breakout without confirmation. This zone may act as a major supply/liquidity area.
🟢 LONG SETUP:
Entry: 1,325–1,338 after bullish confirmation.
🎯 TP1: 1,375
🎯 TP2: 1,403
🛑 SL: 1,295
🔴 SHORT SETUP:
Entry: 1,295–1,310 after rejection/weakness.
🎯 TP1: 1,270
🎯 TP2: 1,245
🛑 SL: 1,338
⚠️ If price reclaims 1,338 with strong volume, bearish pressure can weaken and the market may attempt the 1,355–1,375 liquidity zone.
Conversely, losing 1,270 could expose
the lower support region around 1,245–1,259.
📈 MACD is recovering, while momentum indicators show a short-term bounce, but confirmation remains essential.
🔥 VJ ANALYSIS
Plan your trade. Don’t trade FOMO.
DYOR • Manage Risk • Use Proper Position Size.#zec $ZEC
⚡ VJ ANALYSIS | FOMO + LIQUIDITY SETUP
📌 Current Price: 1,311.30
📉 24H Change: -5.16%
📍 24H High: 1,413
📍 24H Low: 1,270
━━━━━━━━━━━━━━━
🎯 KEY MARKET LEVELS
━━━━━━━━━━━━━━━
🔴 Resistance 1: 1,403–1,430
🔴 Resistance 2: 1,451–1,480
🟢 Supply / Liquidity: 1,355–1,375
🔵 Support 1: 1,270–1,285
🔵 Support 2: 1,245–1,259
💧 Sell-Side Liquidity: Around 1,270
💧 Buy-Side Liquidity: 1,355–1,375
📊 ZEC is trading around 1,311 after a sharp decline from the 1,400+ area and a sweep toward the 1,270 low. The current bounce shows some recovery, but price remains below major moving-average resistance and the broader 1H structure is still under pressure.
🔥 FOMO ALERT:
A sudden move toward 1,355–1,375 could attract late buyers. Avoid chasing a breakout without confirmation. This zone may act as a major supply/liquidity area.
🟢 LONG SETUP:
Entry: 1,325–1,338 after bullish confirmation.
🎯 TP1: 1,375
🎯 TP2: 1,403
🛑 SL: 1,295
🔴 SHORT SETUP:
Entry: 1,295–1,310 after rejection/weakness.
🎯 TP1: 1,270
🎯 TP2: 1,245
🛑 SL: 1,338
⚠️ If price reclaims 1,338 with strong volume, bearish pressure can weaken and the market may attempt the 1,355–1,375 liquidity zone.
Conversely, losing 1,270 could expose
the lower support region around 1,245–1,259.
📈 MACD is recovering, while momentum indicators show a short-term bounce, but confirmation remains essential.
🔥 VJ ANALYSIS
Plan your trade. Don’t trade FOMO.
DYOR • Manage Risk • Use Proper Position Size.#zec $ZEC