




📅 October 2, 2026 | BTC/USDT Technical Analysis
Bitcoin is approaching a critical resistance area after a strong recovery. Buyers still have the advantage within the broader rising structure, but price is now testing the upper boundary of its recent consolidation.
The key question: can BTC turn $86,600 into support and extend toward $87,700, or will sellers force another pullback before the next move?
Here is today’s technical outlook, liquidity analysis, and conditional trade plan.
📊 1. Daily Structure: Bullish Trend, Resistance Ahead
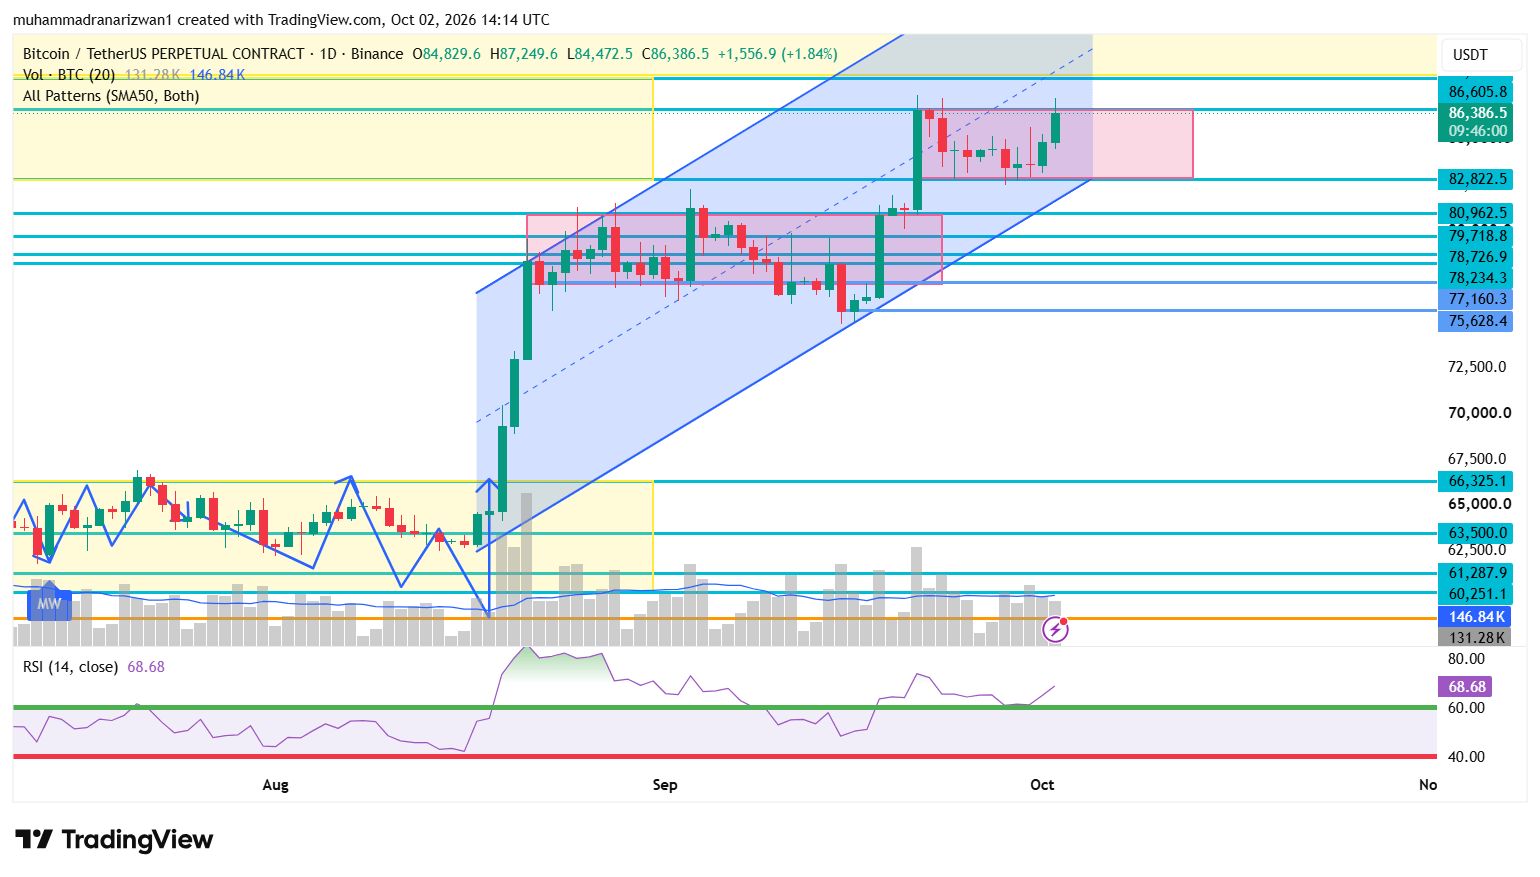
The supplied Binance BTC/USDT perpetual daily chart shows Bitcoin around $86,386, with the session up approximately 1.84% at the screenshot time.
BTC remains inside the ascending channel drawn on the chart. Its recent consolidation sits between approximately $82,822 and $86,606, and price is testing that range’s upper boundary.
This keeps the broader bias bullish, but a breakout still needs confirmation. The session reached approximately $87,250 before returning below $86,606, showing that trading above resistance has not yet produced a sustained breakout.
A strong close above the range ceiling, followed by a successful retest, would strengthen the continuation case. Another rejection would keep the consolidation active.
📈 2. Momentum: Strong, but Chasing Carries Risk
Daily RSI is approximately 68.68 on the chart. Momentum remains strong and is approaching the conventional 70 overbought threshold.
The monitoring report also shows elevated four-hour RSI around 71.78. Together, these readings suggest buyers have momentum, while a short-term cooling phase remains possible.
High RSI does not automatically mean a reversal. However, it makes entry location important: buying directly into resistance can expose traders to a pullback even when the broader trend remains bullish.
🔍 3. Liquidity Levels to Watch
The supplied monitoring report identifies two nearby liquidity reference areas:
• Upside: approximately $87,699.
• Downside: approximately $85,602.
These are potential reaction zones, not guaranteed destinations. Liquidity concentrations can change as traders open and close positions.
A move above the session high near $87,250 could bring $87,700 into focus. However, a brief sweep above resistance followed by a sharp return below it could create a failed-breakout setup.
On the downside, losing $85,600 would weaken the immediate bullish case and bring the session low near $84,473 into view.
💰 4. Market Context: Supportive Signals, Mixed Conditions
The supplied report records approximately $102.67 million in daily net inflows into US spot Bitcoin ETFs, positive open interest, and neutral funding.
That combination provides supportive context, although rising open interest alone does not reveal whether new positions are predominantly bullish or bearish.
The report also shows declining USDT dominance and rising BTC dominance. This is consistent with Bitcoin leading the crypto move, rather than confirming a broad altcoin rally.
A crypto Fear & Greed reading of 72 indicates optimistic sentiment. Meanwhile, the stronger dollar shown in the report remains a factor to watch.
These figures are monitoring snapshots and should be refreshed before trading.
🎯 5. Today’s Key Price Levels
Immediate resistance:
• $86,606 — consolidation ceiling.
• $87,250 — session high on the supplied chart.
• $87,699–$87,704 — reported upside liquidity area.
Immediate support:
• $85,602 — reported downside liquidity reference.
• $84,473 — session low on the supplied chart.
• $82,822 — major consolidation support.
Below $82,822, the next chart supports are approximately $80,962 and $79,719.
🟢 Conditional Long Signal: Pullback and Reclaim
Preferred entry zone: $85,650–$85,800
Stop-loss: $85,250
Take-profit levels:
• TP1: $86,600
• TP2: $87,250
• TP3: $87,700
Trigger: Wait for a test of the $85,600 area, followed by a 15-minute bullish close back above $85,650 and a retest that holds.
The purpose is to confirm that buyers are defending support before entering.
At an illustrative entry of $85,725, the price risk is $475 per BTC. TP1 offers approximately 1.84R, and TP3 approximately 4.16R, before fees and slippage.
Cancel this setup if price breaks support and fails to reclaim it. A limit order in the zone without confirmation is a different, riskier trade.
🔴 Alternative Short Signal: Failed Upside Breakout
Preferred entry zone: $87,500–$87,700
Stop-loss: $88,100
Take-profit levels:
• TP1: $86,600
• TP2: $85,600
• TP3: $84,500
Trigger: Price must first test or sweep the $87,700 area, then close back below $87,500 on the 15-minute chart and fail to reclaim it.
This is a countertrend rejection setup. It becomes relevant only if the upside attempt fails.
At an illustrative entry of $87,600, the price risk is $500 per BTC. TP1 offers approximately 2R before costs.
Cancel the short idea if BTC holds above $87,700 and establishes support there.
⚠️ Execution Matters
These are conditional setups, not immediate market-entry calls. Choose the scenario price confirms, use a stop-loss, and size the position from the stop distance.
For conservative execution, consider limiting account risk to 0.25%–0.5% per trade. Leverage changes margin requirements; position size and stop distance determine planned loss. Actual losses can exceed that plan during slippage.
📌 My BTC Outlook
The broader structure favors buyers while $82,822 holds, but the immediate decision is around $86,606.
Acceptance above that level would strengthen the case for $87,250 and $87,700. Rejection would bring $85,600 back into focus, with $84,473 below it.
My preference is a confirmed support reclaim or a breakout retest. Let price confirm the opportunity before committing capital.
Educational analysis only. Targets and profits are not guaranteed.
#bitcoin #BTC走势分析 #cryptotrading #BTCanalysis #muhammadranarizwan