🚨 BITCOIN 4-YEAR CYCLE: REPEAT OR BREAK? 📈
Asset: BTC/USD (Macro Long-Term Structure)
Focus: Historical Halving Rhythm & Market Phases
📊 HISTORICAL CYCLE PROGRESSION
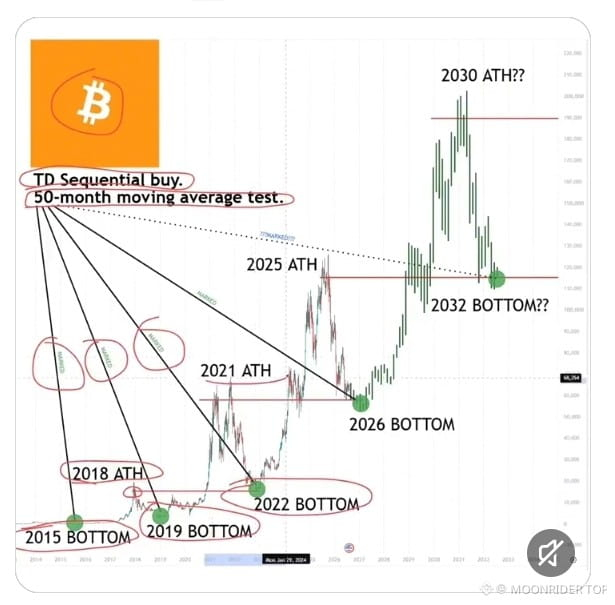
• Cycle 1 (2011–2014) : 2011 Buy ➔ 2012 Hold ➔ 2013 Top ➔ 2014 Bear Market Floor
• Cycle 2 (2015–2018) : 2015 Bottom ➔ 2016 Buy ➔ 2017 Peak (20K) ➔ 2018 Bear Reset
• Cycle 3 (2019–2022) : 2019 Recovery ➔ 2021 Peak (69K) ➔ 2022 Capitulation Low
• Current Cycle Phase : Tracking multi-year trendlines, moving average tests, and sequential buy signals toward long-term projections.
📐 MACRO TECHNICAL STRUCTURE
1. Trendline Projections: Successive higher lows across macro cycles establishing predictable multi-year support boundaries.
2. Key Moving Average Tests: Long-term indicators (such as the 50-month moving average) continuing to act as historic structural backstops.
3. Future Horizons: Long-range fractal models projecting future cycle peaks and subsequent consolidation lows.
⚡ STRATEGIC ROADMAP
• Macro Accumulation: Focus on multi-year structural support zones rather than short-term noise.
• Risk Management: Understand that historical rhythms provide context, but macroeconomic liquidity ultimately dictates market velocity.
⚠️ Disclaimer: Macro cycle projections are for educational and structural analysis frameworks. Always align trades with your personal risk tolerance.$BTC
Asset: BTC/USD (Macro Long-Term Structure)
Focus: Historical Halving Rhythm & Market Phases
📊 HISTORICAL CYCLE PROGRESSION
• Cycle 1 (2011–2014) : 2011 Buy ➔ 2012 Hold ➔ 2013 Top ➔ 2014 Bear Market Floor
• Cycle 2 (2015–2018) : 2015 Bottom ➔ 2016 Buy ➔ 2017 Peak (20K) ➔ 2018 Bear Reset
• Cycle 3 (2019–2022) : 2019 Recovery ➔ 2021 Peak (69K) ➔ 2022 Capitulation Low
• Current Cycle Phase : Tracking multi-year trendlines, moving average tests, and sequential buy signals toward long-term projections.
📐 MACRO TECHNICAL STRUCTURE
1. Trendline Projections: Successive higher lows across macro cycles establishing predictable multi-year support boundaries.
2. Key Moving Average Tests: Long-term indicators (such as the 50-month moving average) continuing to act as historic structural backstops.
3. Future Horizons: Long-range fractal models projecting future cycle peaks and subsequent consolidation lows.
⚡ STRATEGIC ROADMAP
• Macro Accumulation: Focus on multi-year structural support zones rather than short-term noise.
• Risk Management: Understand that historical rhythms provide context, but macroeconomic liquidity ultimately dictates market velocity.
⚠️ Disclaimer: Macro cycle projections are for educational and structural analysis frameworks. Always align trades with your personal risk tolerance.$BTC