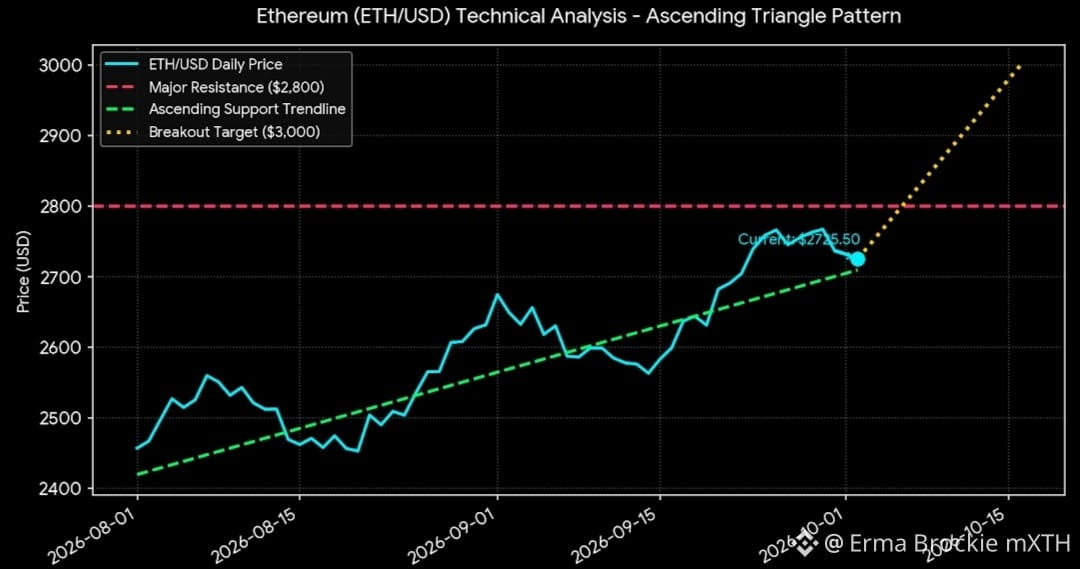
Here is the Ethereum ($ETH) technical chart illustrating the current Ascending Triangle pattern and price action
Key Technical Patterns on the Chart
Resistance Ceiling ($2,800): Indicated by the red dashed line where price encounters persistent selling pressure. A daily candle close above $2,800 signals a bullish breakout.
Ascending Support Line: Highlighted by the green dashed line, connecting higher price lows from $2,420 through $2,600 up to the current level of $2,725.50.
Measured Breakout Target ($3,000): Displayed by the yellow dotted line, representing the vertical projection based on the height of the triangle pattern once $2,800 is breached.
Key Technical Patterns on the Chart
Resistance Ceiling ($2,800): Indicated by the red dashed line where price encounters persistent selling pressure. A daily candle close above $2,800 signals a bullish breakout.
Ascending Support Line: Highlighted by the green dashed line, connecting higher price lows from $2,420 through $2,600 up to the current level of $2,725.50.
Measured Breakout Target ($3,000): Displayed by the yellow dotted line, representing the vertical projection based on the height of the triangle pattern once $2,800 is breached.