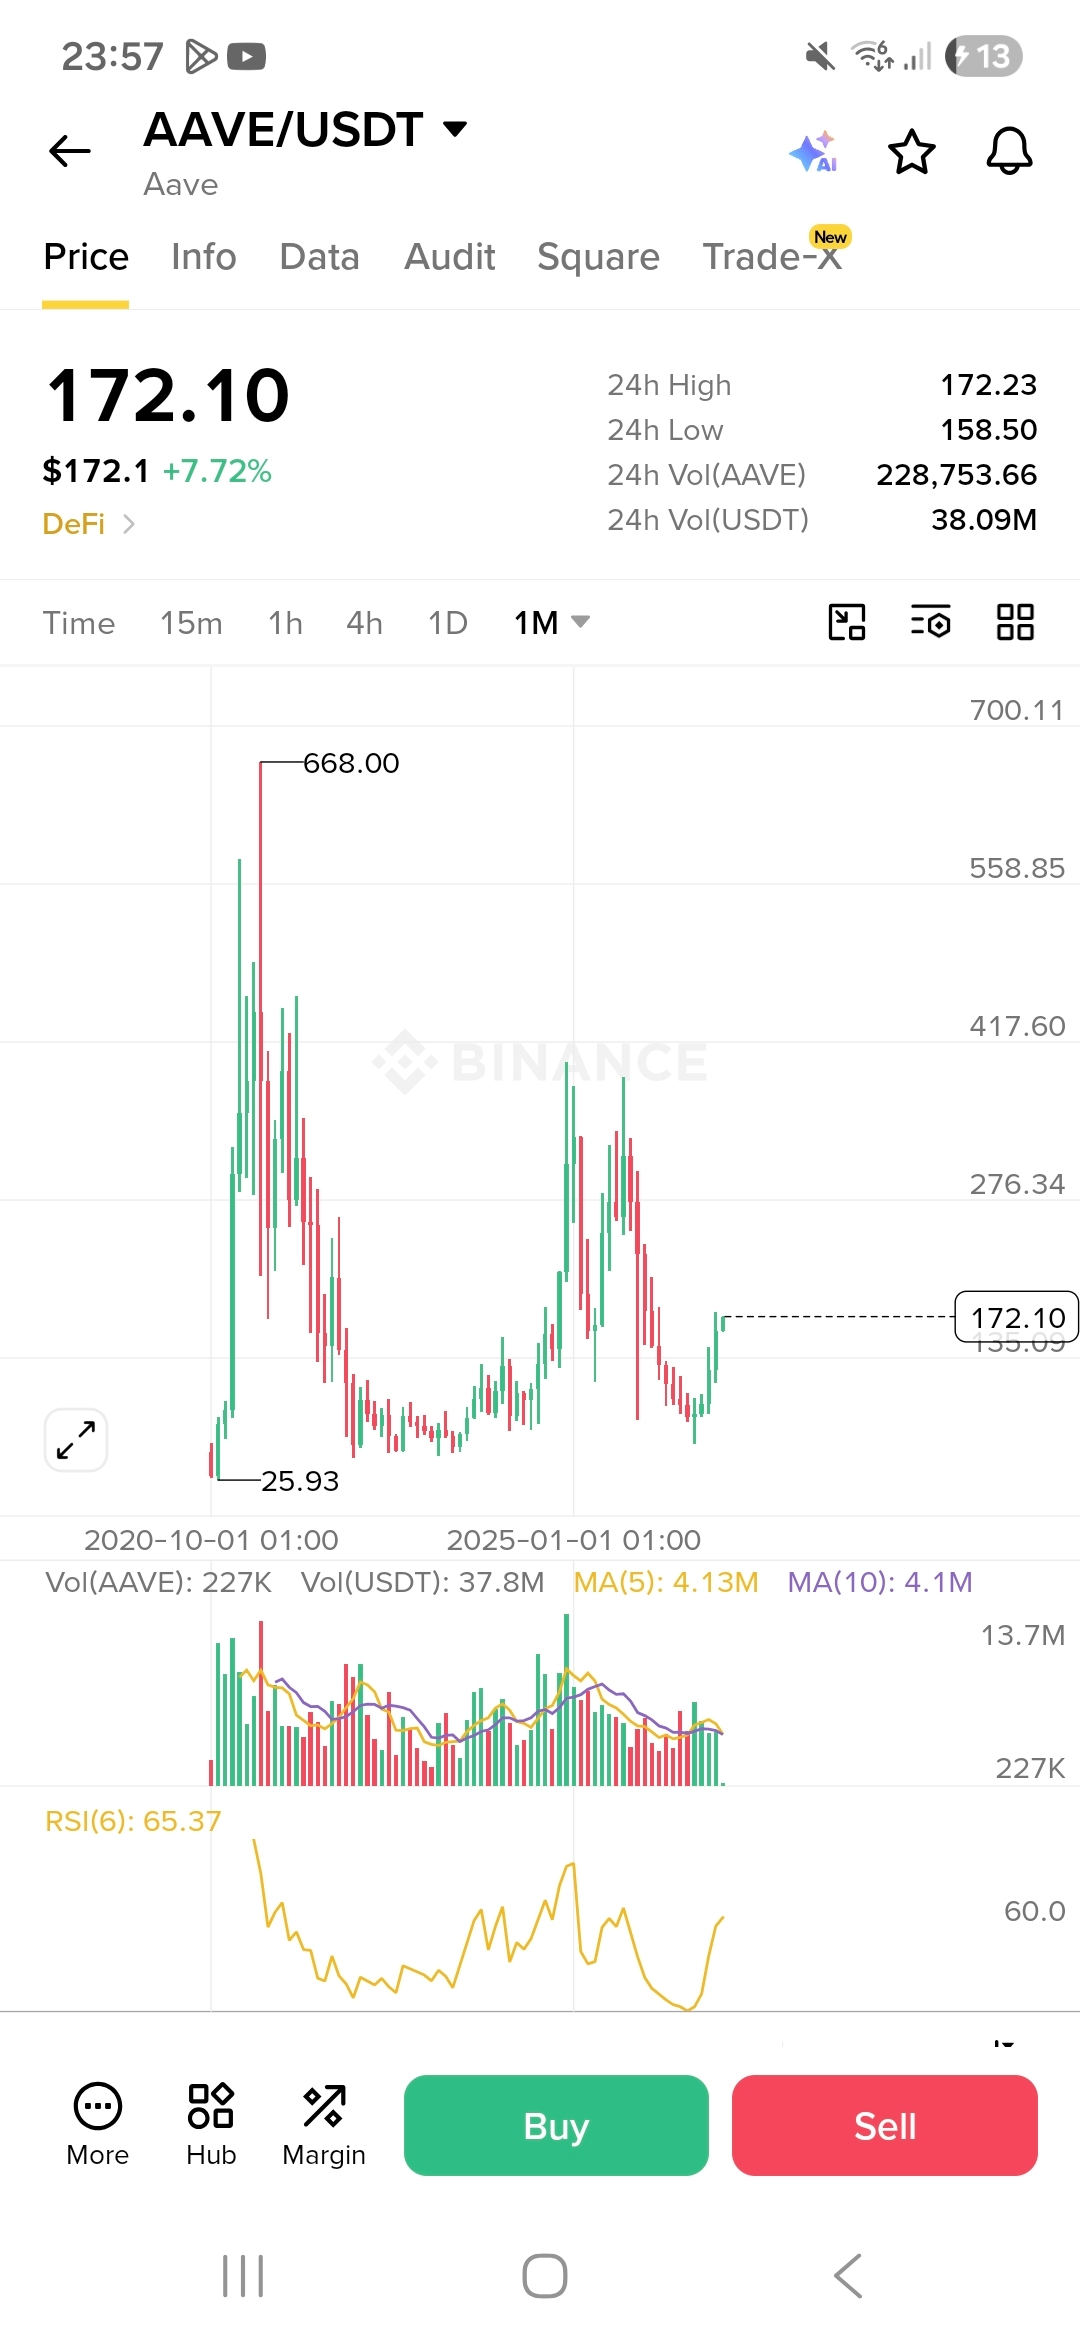

The 1M (monthly) chart of the AAVE/USDT pair appears to be forming a Double Bottom pattern, also known as a “W” pattern. This is generally considered a potentially strong bullish reversal pattern on higher timeframes.
Key Technical Details:
Double Bottom / W Pattern:
First Bottom: Formed in the lower region around the $25.93–$50 area.
Second Bottom: Formed at relatively similar levels, followed by a bullish rebound.
Neckline: The neckline is located around the previous intermediate high between the two bottoms, approximately in the $260–$300 area.
RSI (Relative Strength Index):
The RSI is showing an upward trend at around 65.37, indicating strong buying momentum and supporting the possibility of continued upward movement.
Current Price Action:
The price is currently trading around $172.10 and is moving toward a potential test of the pattern’s neckline.
Potential Trading Scenarios:
Bullish Scenario – Pattern Confirmation:
A breakout of the $260–$300 neckline area, followed by a monthly close above it, would confirm the completion of the Double Bottom pattern.
The technical target can be calculated by measuring the distance between the bottom of the pattern and the neckline, then projecting that distance upward from the breakout point. This could potentially open the way toward higher levels, possibly above $450–$500 over the long term.
Cautious Scenario:
As long as the price remains below the neckline, the pattern should be considered still in formation and not officially confirmed.
A rejection from nearby resistance levels could lead to further sideways consolidation before another attempt to break above the neckline.
Summary:
The chart presents a potentially bullish technical structure, but confirmation would require a monthly breakout and close above the $260–$300 neckline area. Until that happens, the Double Bottom remains a developing pattern rather than a confirmed reversal signal.