
Mastering RSI Signals: The Complete Divergence Guide With Practical Examples
The Relative Strength Index (RSI) is one of the most important momentum indicators in the crypto market. It measures the speed and change of price movements on a scale from 0 to 100. The traditional rule says that above 70 means overbought and below 30 means oversold, but the real power of RSI lies in reading the divergence between price action and the indicator itself.
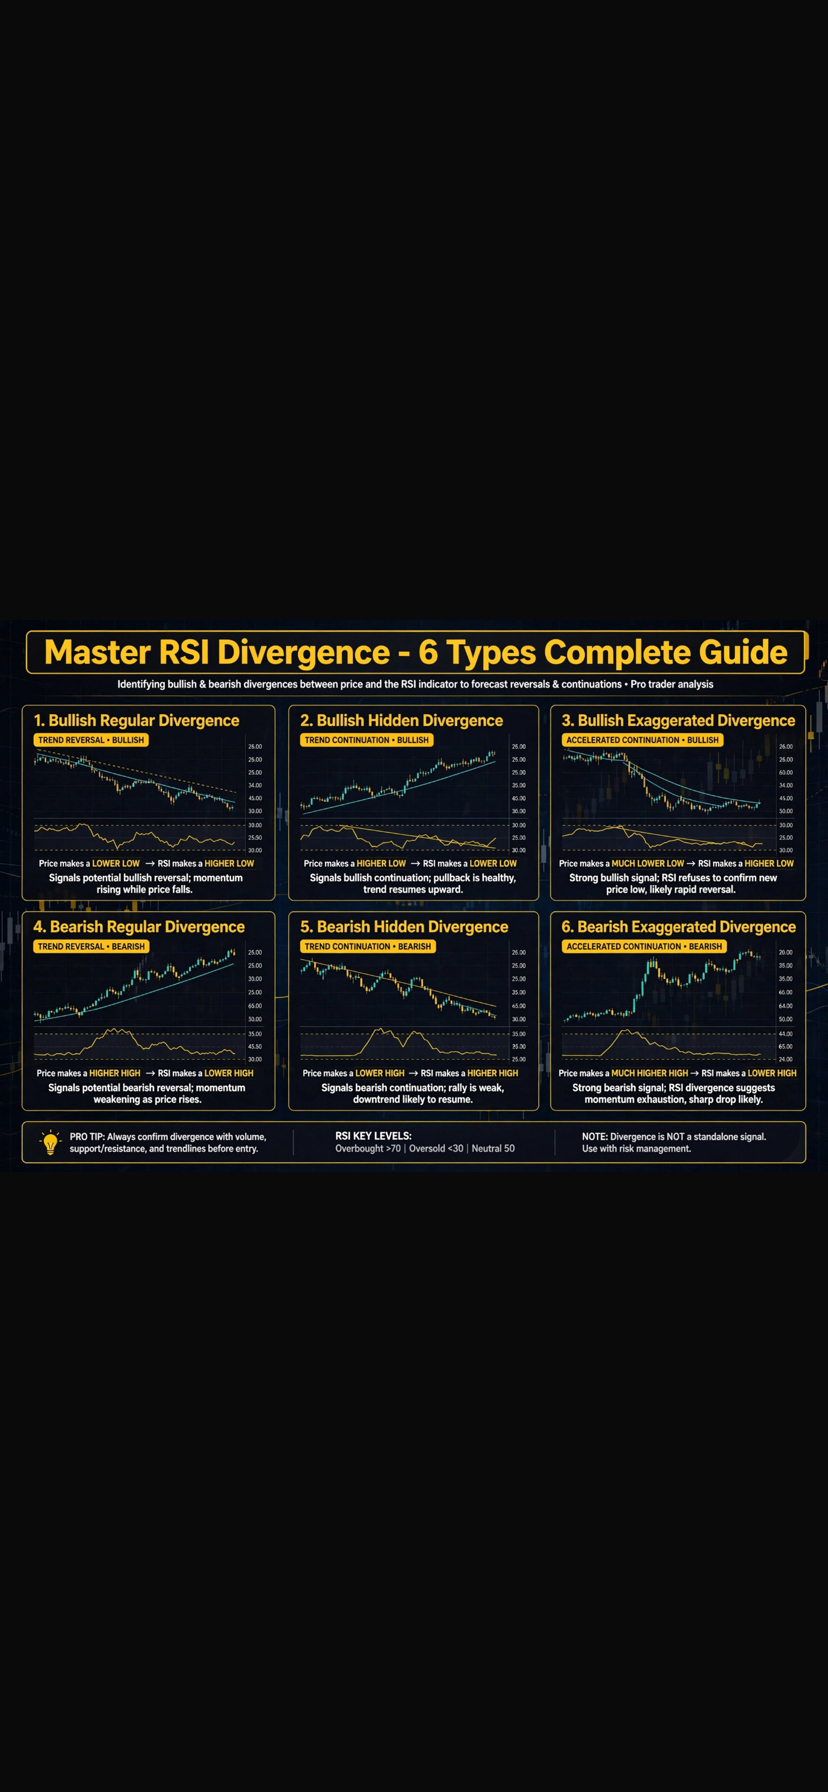
Divergence occurs when price moves in one direction while RSI moves in the opposite direction. It is one of the strongest early signals that reveals weakness in the current trend or a potential reversal.
Part 1: Bullish Divergence
This type appears during a downtrend and indicates weakening sellers and a potential upside bounce.
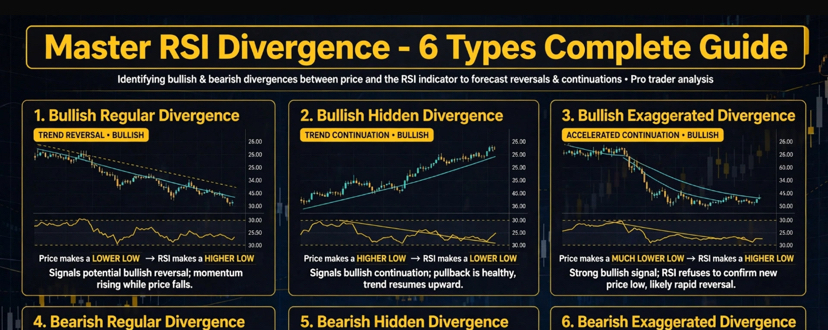
1. Regular Bullish Divergence - Strong Bullish Reversal Signal
This happens when price makes a lower low than the previous low, while RSI makes a higher low. Although price dropped further, bearish momentum weakened.
Practical Example: Bitcoin drops from 65,000 to 60,000, bounces to 62,000, then drops again to 58,000 - a lower low. At the same time, RSI was 28 at the first low and 41 at the second low - a higher low. This difference means sellers lost strength, and a professional trader waits for a strong bullish candle to enter a long position.
2. Hidden Bullish Divergence - Bullish Continuation Signal
Appears during a temporary correction in an uptrend. Price makes a higher low than the previous low, while RSI makes a lower low.
Practical Example: ETH is in an uptrend and corrects slightly. Its low was at 3,000, then rose to 3,500, then dropped to 3,200 - a higher low. At the same time, RSI fell from 55 to 38 - a lower low. Price maintains higher lows while RSI makes a lower low, meaning the correction is weak and the uptrend will continue. It's an opportunity to add to a long.
3. Exaggerated Bullish Divergence - Hidden Bullish Reversal
Occurs when price makes two almost equal lows, while RSI makes a higher low. Equal price lows with rising RSI lows reveal hidden accumulation.
Practical Example: BNB trading at 600 touches 580 twice, two equal lows. But RSI was 32 the first time and 48 the second time - a clear higher low. Price stability with rising RSI means silent buyers are entering, often followed by a breakout to the upside.
Part 2: Bearish Divergence
This type appears during an uptrend and indicates weakening buyers and a potential downside move.
4. Regular Bearish Divergence - Strong Bearish Reversal Signal
Happens when price makes a higher high than the previous high, while RSI makes a lower high. Despite price rising, buying power fades.
Practical Example: Solana SOL rises from 150 to 180, corrects to 165, then rises to 190 - a higher high. But RSI was 78 at the first high and 62 at the second high - a lower high. Price makes higher highs and RSI makes lower highs, a strong signal to exit or open a short.
5. Hidden Bearish Divergence - Bearish Continuation Signal
Occurs during a temporary bounce in a downtrend. Price makes a lower high than the previous high, while RSI makes a higher high.
Practical Example: XRP in a downtrend bounces from 0.50 to 0.58, then drops to 0.48, then bounces again to 0.55 - a lower high. RSI in the first bounce was 45 and in the second 58 - a higher high. Price makes lower highs and RSI makes higher highs, meaning the bounce is fake and the downtrend continues.
6. Exaggerated Bearish Divergence - Potential Bearish Reversal
Happens when price makes two equal highs, while RSI makes a lower high. Stable price highs with declining indicator highs reveal distribution.
Practical Example: DOGE at 0.15 makes two equal highs at 0.16 within a week, but RSI was 72 at the first high and 55 at the second - a lower high. Stable highs with weak momentum means buyers are exhausted, often followed by a sharp drop.
How to Apply Divergence Professionally on Binance?
Never enter a trade just because divergence appears. The professional way is to combine divergence with other tools. Draw divergence on the 4-hour or daily timeframe as it's more reliable than smaller timeframes, and keep RSI settings at 14. After divergence appears, wait for confirmation such as a break of a minor trendline or an engulfing candle, place your stop-loss below the last low for longs or above the last high for shorts, and combine the signal with strong support and resistance zones to increase your success rate.