SUI Nears Golden Cross; Potential $4 Target
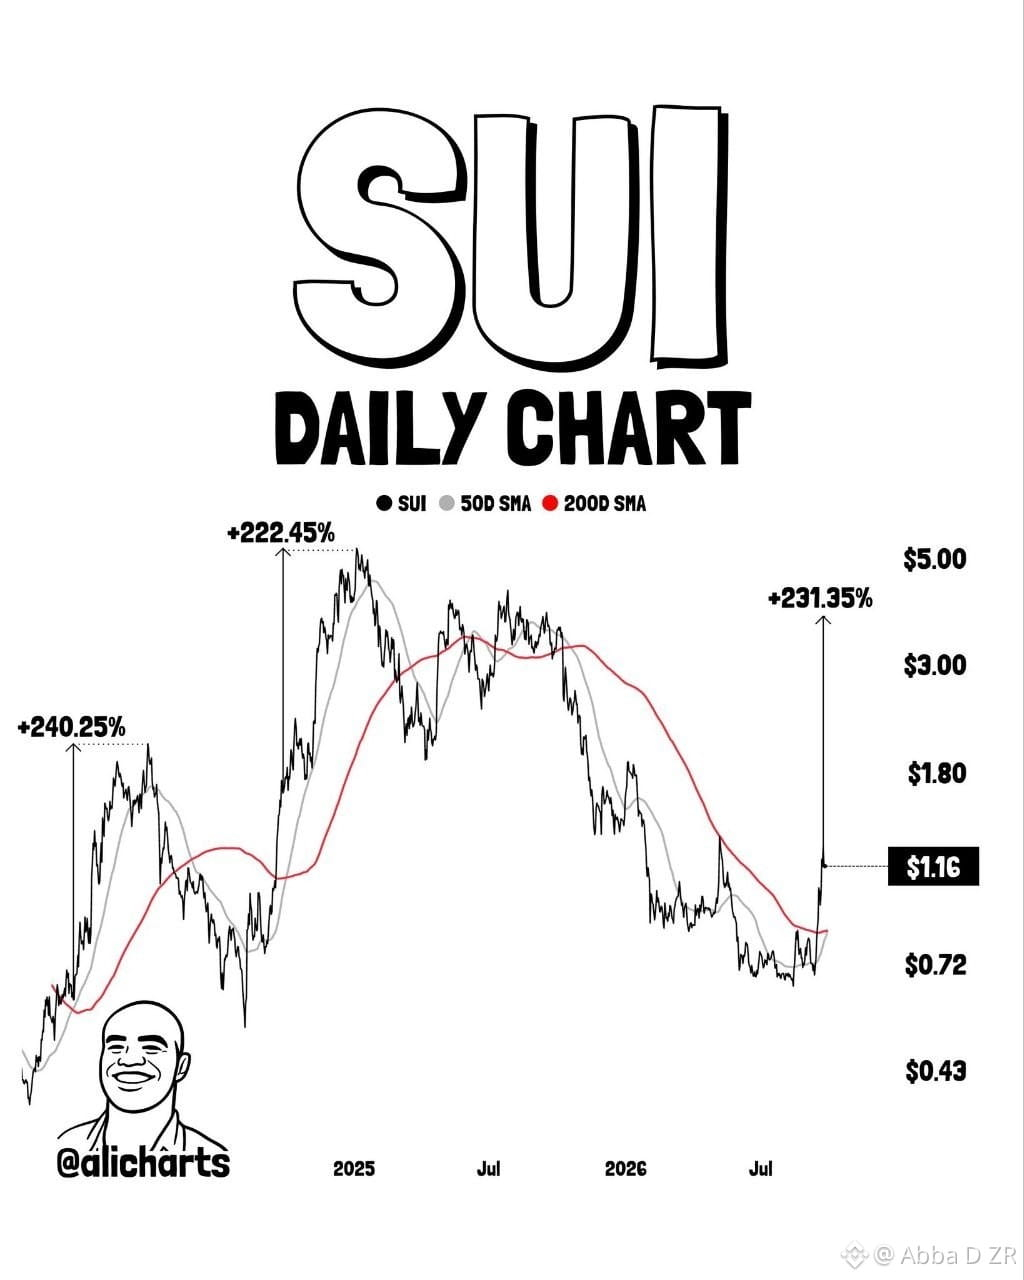
SUI’s 50-day moving average is crossing above its 200-day moving average—a pattern typically recognized as a long-term bullish signal.
Previous Golden Crosses in December 2023 and October 2024 were followed by gains of approximately 240% and 222%, respectively.
If history repeats itself, a similar 230% rally could push SUI toward the $4 mark.
Analysis by Ali Martinez
#SUİ $SUI
SUI’s 50-day moving average is crossing above its 200-day moving average—a pattern typically recognized as a long-term bullish signal.
Previous Golden Crosses in December 2023 and October 2024 were followed by gains of approximately 240% and 222%, respectively.
If history repeats itself, a similar 230% rally could push SUI toward the $4 mark.
Analysis by Ali Martinez
#SUİ $SUI