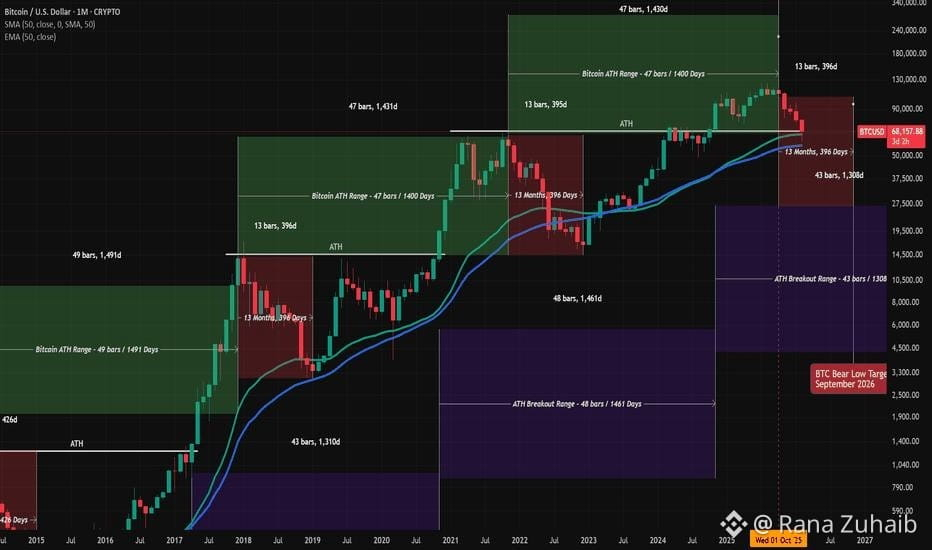
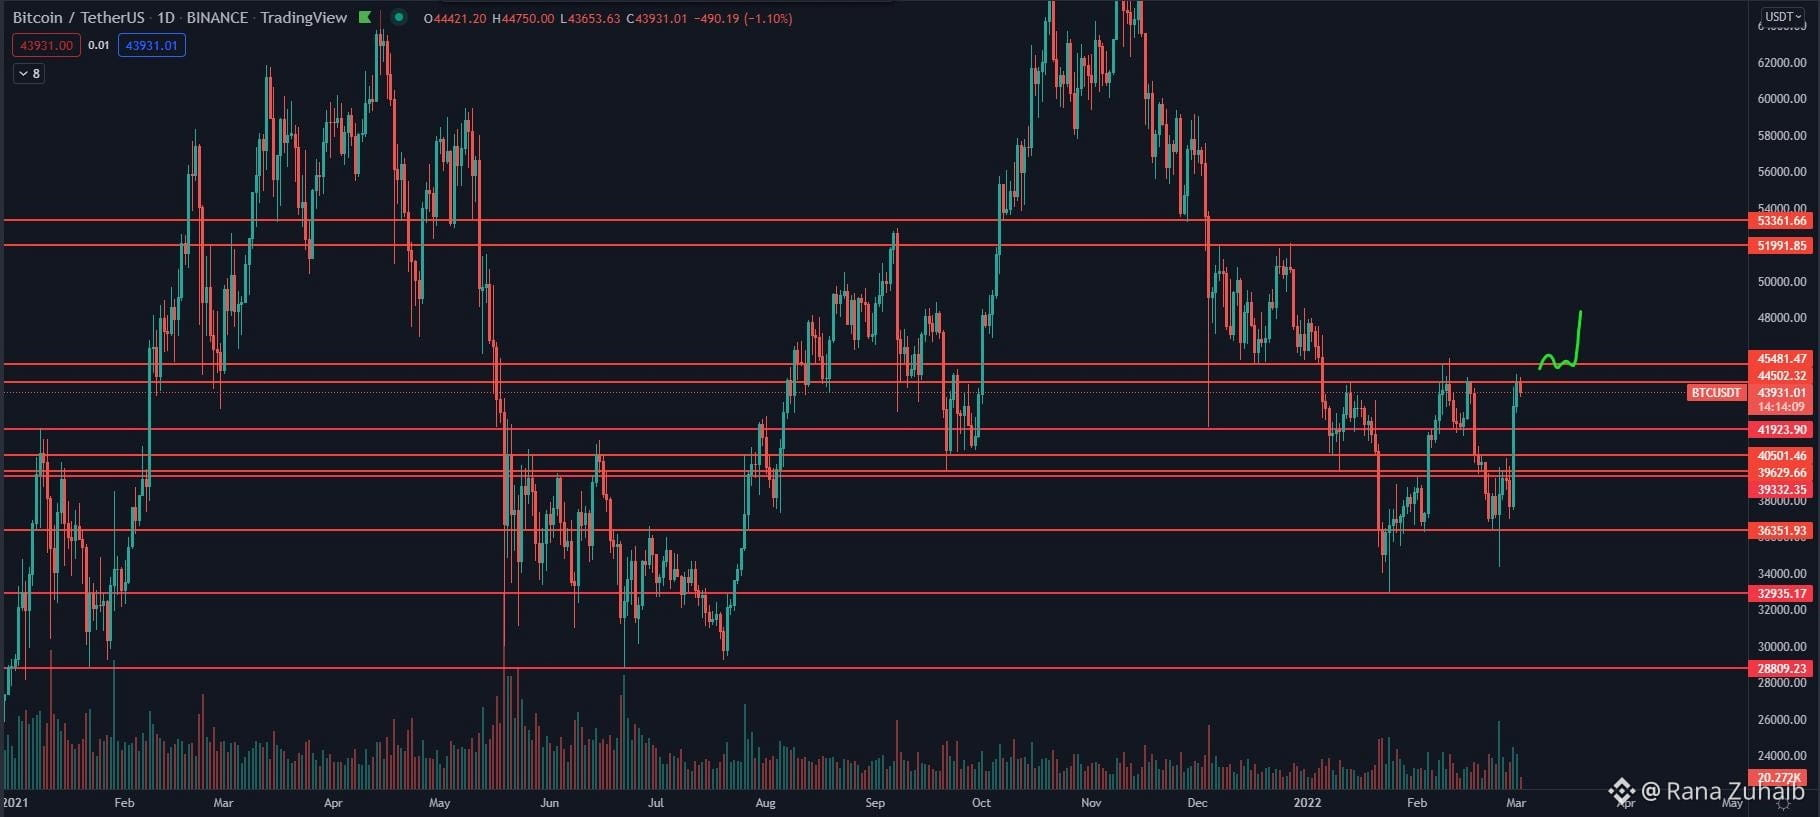
$BTC Resistance levels
$85,000–$85,500 — immediate resistance $87,000–$87,500 — next important area $90,000 — major psychological level
A sustained move above $85.5K would indicate that buyers are regaining control of the short-term range.
Support levels
$82,000–$82,500 — important near-term support $80,000 — major psychological support Below $80K, downside momentum could increase.
🐂 Bullish scenario
If BTC holds $82K–$83K and breaks decisively above $85.5K, the next areas traders may watch are approximately $87K and $90K.
Institutional demand is an important factor. U.S. spot Bitcoin ETFs attracted about $2.4 billion in net inflows during the week ending September 25, their strongest weekly inflow in nearly a year.
🐻 Bearish scenario
The major risk is that BTC repeatedly fails around $85K while support at $82K breaks.
High U.S. Treasury yields are currently an important headwind. The 10-year yield reached around 5.3%, close to its highest level since 2002, making risk assets such as Bitcoin more sensitive to macroeconomic conditions.
If $82K fails, traders could start watching $80K and potentially lower levels.
🌍 Macro factors
The next major catalyst is U.S. employment data. Softer labor-market data could reduce pressure from interest-rate expectations, while stronger data could keep yields elevated and limit Bitcoin's upside.
There is also a contrast in institutional views: Citigroup raised its 12-month Bitcoin forecast to $113,000, citing stronger crypto activity, macro conditions and renewed ETF inflows. That's a bank forecast—not a guarantee of where BTC will trade.
🔎 My neutral market map
BTC levelWhat it meansAbove $90KStronger upside momentum$87K–$90KMajor resistance zone$85K–$87KBreakout area$82K–$85KCurrent key range$80K–$82KImportant supportBelow $80KIncreased downside risk
#DollarIndexHitsHighestSinceMay2025 #EtherGains70.9%InQ3 #US10YearYieldNears5.3% #USWeeklyJoblessClaimsFallTo197000 #BitcoinETFsTake$6.34BillionInQ3
$85,000–$85,500 — immediate resistance $87,000–$87,500 — next important area $90,000 — major psychological level
A sustained move above $85.5K would indicate that buyers are regaining control of the short-term range.
Support levels
$82,000–$82,500 — important near-term support $80,000 — major psychological support Below $80K, downside momentum could increase.
🐂 Bullish scenario
If BTC holds $82K–$83K and breaks decisively above $85.5K, the next areas traders may watch are approximately $87K and $90K.
Institutional demand is an important factor. U.S. spot Bitcoin ETFs attracted about $2.4 billion in net inflows during the week ending September 25, their strongest weekly inflow in nearly a year.
🐻 Bearish scenario
The major risk is that BTC repeatedly fails around $85K while support at $82K breaks.
High U.S. Treasury yields are currently an important headwind. The 10-year yield reached around 5.3%, close to its highest level since 2002, making risk assets such as Bitcoin more sensitive to macroeconomic conditions.
If $82K fails, traders could start watching $80K and potentially lower levels.
🌍 Macro factors
The next major catalyst is U.S. employment data. Softer labor-market data could reduce pressure from interest-rate expectations, while stronger data could keep yields elevated and limit Bitcoin's upside.
There is also a contrast in institutional views: Citigroup raised its 12-month Bitcoin forecast to $113,000, citing stronger crypto activity, macro conditions and renewed ETF inflows. That's a bank forecast—not a guarantee of where BTC will trade.
🔎 My neutral market map
BTC levelWhat it meansAbove $90KStronger upside momentum$87K–$90KMajor resistance zone$85K–$87KBreakout area$82K–$85KCurrent key range$80K–$82KImportant supportBelow $80KIncreased downside risk
#DollarIndexHitsHighestSinceMay2025 #EtherGains70.9%InQ3 #US10YearYieldNears5.3% #USWeeklyJoblessClaimsFallTo197000 #BitcoinETFsTake$6.34BillionInQ3