🚨 $ETH OCT 1 UPDATE: Key Resistance Reached — Is $3,000 Next?
Ethereum ($ETH ) enters October showing significant momentum. After holding strong gains through September, is currently hovering in the $2,680 - $2,695 range, testing vital technical resistance levels.
Here is a breakdown of what the technical chart and market data show today:
📊 Technical Analysis & Key Levels
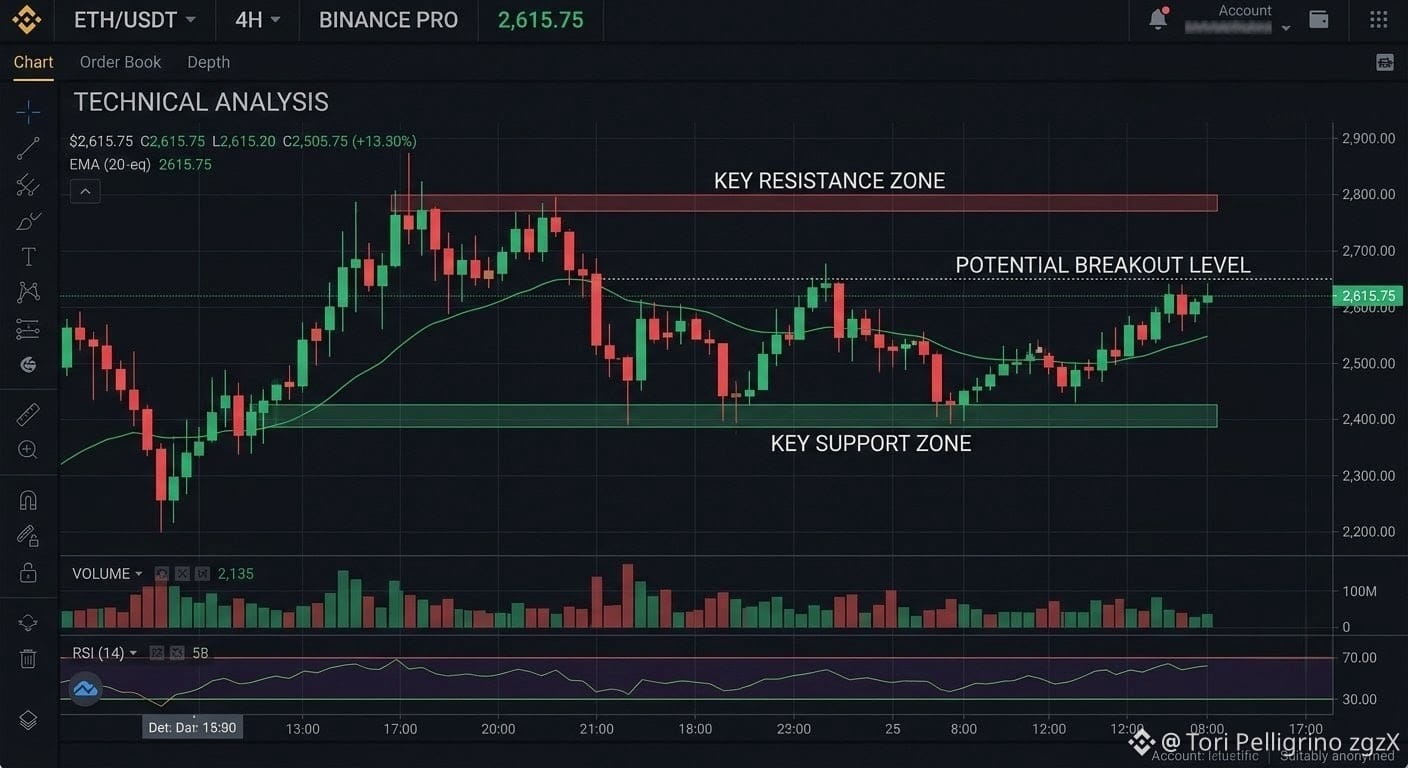
Resistance Test ($2,750 - $2,800):
$ETH is actively consolidating just below the major $2,750 resistance zone.
A clean daily close above $2,750 clears the path toward the psychological $3,000 target.
Moving Average Support:
$ETH remains well-supported above its 20-day EMA ($2,617) and its 50-day EMA ($2,445).
The medium-term structure stays bullish as long as trades above the $2,600 support belt.
Market Sentiment & Derivatives Data:
Open interest across major trading platforms shows strong institutional and retail engagement.
Historically, October ("Uptober") averages positive returns for Ethereum, with bulls pushing to establish a new local high.
🎯 Trading Scenarios
Bullish Breakout: A breakout above $2,750 with volume confirmation opens targets at $2,880 and $3,000.
Bearish Retest: Failure to break $2,750 could cause a short-term pullback toward the $2,617 - $2,500 support zone before the next leg up.
💡 What's your play? Are you long or waiting for the $2,750 breakout? Let us know in the comments below! 👇
#Ethereum #ETH #CryptoAnalysis #BinanceSquare #TechnicalAnalysis
Ethereum ($ETH ) enters October showing significant momentum. After holding strong gains through September, is currently hovering in the $2,680 - $2,695 range, testing vital technical resistance levels.
Here is a breakdown of what the technical chart and market data show today:
📊 Technical Analysis & Key Levels
Resistance Test ($2,750 - $2,800):
$ETH is actively consolidating just below the major $2,750 resistance zone.
A clean daily close above $2,750 clears the path toward the psychological $3,000 target.
Moving Average Support:
$ETH remains well-supported above its 20-day EMA ($2,617) and its 50-day EMA ($2,445).
The medium-term structure stays bullish as long as trades above the $2,600 support belt.
Market Sentiment & Derivatives Data:
Open interest across major trading platforms shows strong institutional and retail engagement.
Historically, October ("Uptober") averages positive returns for Ethereum, with bulls pushing to establish a new local high.
🎯 Trading Scenarios
Bullish Breakout: A breakout above $2,750 with volume confirmation opens targets at $2,880 and $3,000.
Bearish Retest: Failure to break $2,750 could cause a short-term pullback toward the $2,617 - $2,500 support zone before the next leg up.
💡 What's your play? Are you long or waiting for the $2,750 breakout? Let us know in the comments below! 👇
#Ethereum #ETH #CryptoAnalysis #BinanceSquare #TechnicalAnalysis