🚨 $AGT Daily Analysis: Approaching Key Supply Zone! 📉
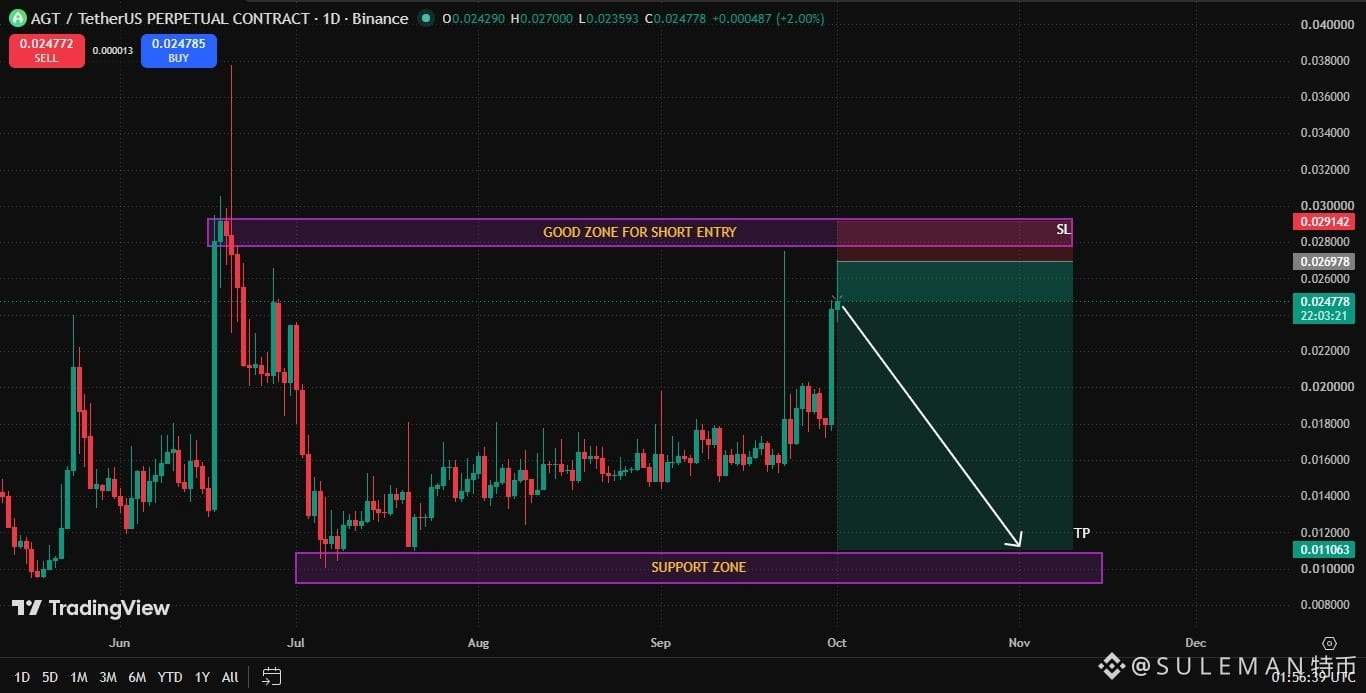
AGT has rallied sharply off its local lows, currently pushing up toward a major resistance range between $0.027–$0.029.
Analysis (1D Chart):
On the daily chart, price action is retesting a key historic resistance zone that previously triggered a full retracement back down to the $0.011 support level.
Key Levels & Scenarios
* 🔴 Bearish Rejection: A rejection inside $0.027–$0.029 presents a high-R:R short setup targeting $0.011 (TP). Tight Stop Loss placed at $0.02914.
* 🟢 Bullish Breakout: A clean daily candle close above $0.0292 invalidates the bearish short setup and signals potential trend continuation.
My View:
Exercise patience and wait for structural rejection confirmation inside the resistance zone before taking entry. Always maintain strict discipline and stick to defined stop losses.
$ZEC
$LYN
AGT has rallied sharply off its local lows, currently pushing up toward a major resistance range between $0.027–$0.029.
Analysis (1D Chart):
On the daily chart, price action is retesting a key historic resistance zone that previously triggered a full retracement back down to the $0.011 support level.
Key Levels & Scenarios
* 🔴 Bearish Rejection: A rejection inside $0.027–$0.029 presents a high-R:R short setup targeting $0.011 (TP). Tight Stop Loss placed at $0.02914.
* 🟢 Bullish Breakout: A clean daily candle close above $0.0292 invalidates the bearish short setup and signals potential trend continuation.
My View:
Exercise patience and wait for structural rejection confirmation inside the resistance zone before taking entry. Always maintain strict discipline and stick to defined stop losses.
$ZEC
$LYN