
Bitcoin has always been a market of cycles
When we look at Bitcoins long term price history one pattern stands out major bull markets have repeatedly appeared around the Bitcoin halving cycle followed by periods of correction accumulation and eventually another expansion
This does not mean that Bitcoin must repeat the same pattern every four years However the historical structure is interesting enough to deserve closer attention
The Halving Cycle
Bitcoins block reward is programmed to be reduced by half approximately every four years
The major halvings occurred in
2012 50 BTC 25 BTC
2016 25 BTC 12 point 5 BTC
2020 12 point 5 BTC 6 point 25 BTC
2024 6 point 25 BTC 3 point 125 BTC
2028 expected to reduce the reward to 1 point 5625 BTC
The next halving is currently estimated for 2028
Historically Bitcoins major post halving cycle highs occurred roughly 12 to 18 months after the halving in the first three cycles The 2017 peak came about 525 days after the 2016 halving while the 2021 peak came about 549 days after the 2020 halving
Looking at the Previous Cycles
The historical price structure can be simplified into several stages
Accumulation Rally Peak Decline Bottom Accumulation
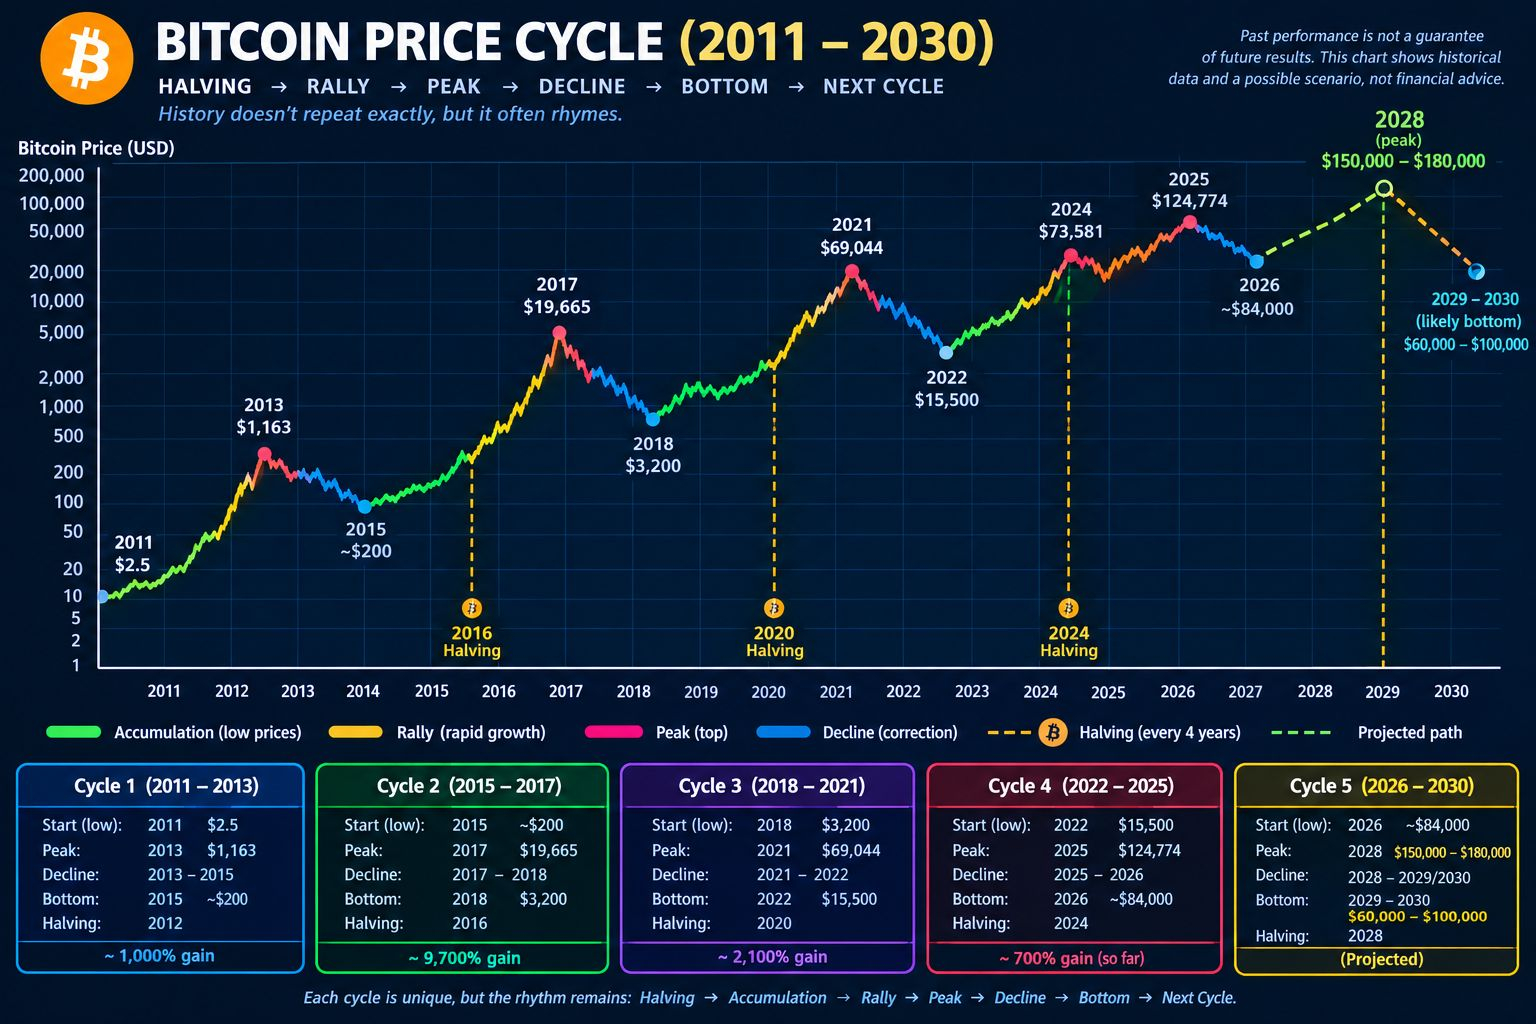
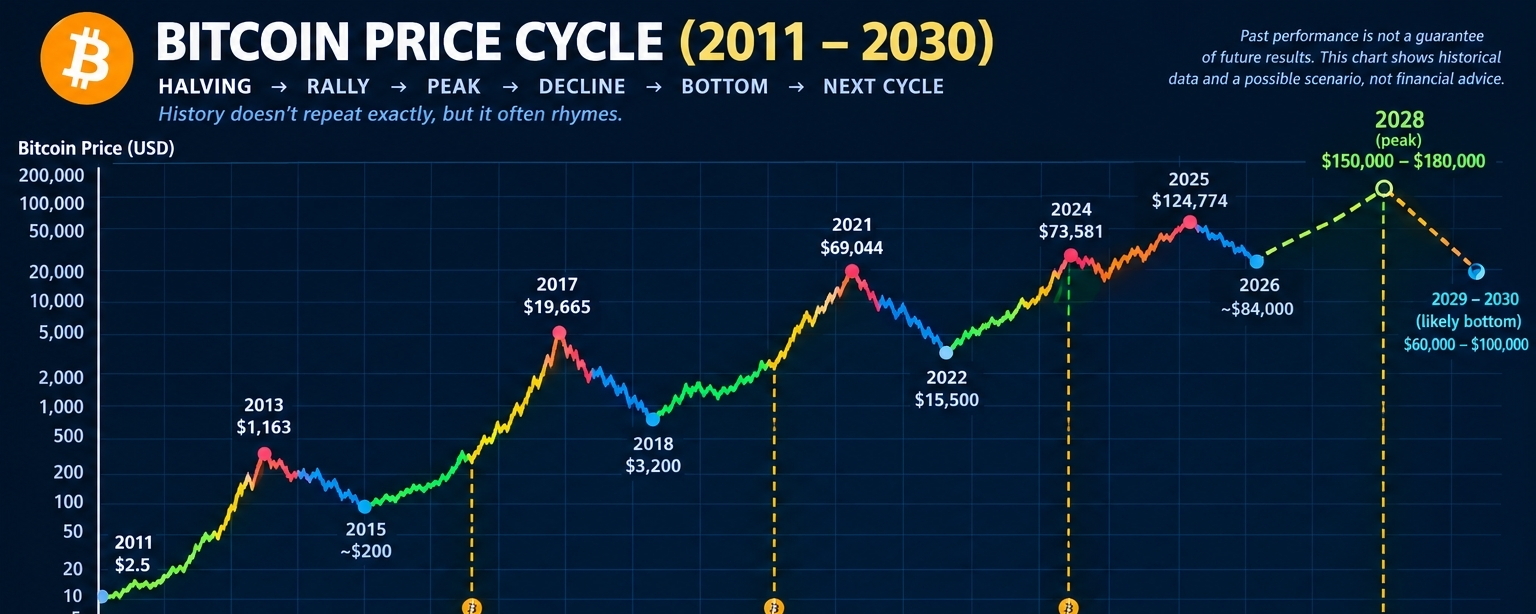
The first major cycle saw Bitcoin rise from extremely low prices to more than 1000 dollars in 2013
After the subsequent correction Bitcoin entered another accumulation phase and eventually reached approximately 19665 dollars in December 2017
The next major cycle culminated in Bitcoin reaching approximately 69044 dollars in November 2021
Then came the 2022 bear market during which Bitcoin fell dramatically before beginning another recovery
These cycles were not identical but the broad structure remained recognizable
The 2024 Cycle Was Different
The 2024 cycle introduced an important change
Bitcoin reached a new all time high of approximately 73581 dollars in March 2024 before the April 2024 halving
That was unusual because previous major cycle highs had generally occurred after the halving CoinGecko notes that this was the first time since 2012 that Bitcoin established a new ATH before the halving
Bitcoin subsequently continued to make new highs during 2025 reaching approximately 124128 dollars on August 14 2025 according to CoinGeckos historical analysis
This suggests that the traditional four year model may still be useful as a framework but the exact timing of peaks is becoming less predictable
What About 2028
This is where the chart becomes particularly interesting
If the broad four year rhythm continues the next major halving is expected in 2028
One possible scenario would therefore look like this
2026 to 2027
Correction consolidation and accumulation
2028
Next halving followed by a potential expansion phase
2028 to 2029
Potential cycle peak
After the peak
Another period of correction and accumulation
The chart presents 150000 to 180000 dollars as a possible 2028 peak scenario
But this number should not be interpreted as a prediction or a guaranteed target
It is simply a hypothetical range based on the idea that Bitcoin could continue making new highs while the percentage gains of each cycle become progressively smaller
Why 150K to 180K
There is an important observation here
Bitcoins percentage gains have historically become smaller with each major cycle
CoinGeckos analysis found that cycle returns have compressed substantially the post halving gain was around 29x in 2017 about 6 point 7x in 2021 and considerably smaller in the 2025 cycle
If this trend continues Bitcoin does not necessarily need another explosive 10x or 20x move to establish a new cycle high
A move toward the 150K to 180K area could represent a continuation of the long term upward trend while still reflecting diminishing returns
Again this is a scenario not a certainty
The Most Important Part of the Chart
The most interesting feature is not the exact price target
It is the shape of the curve
Each cycle appears to contain several psychological phases
1 Capitulation
The previous cycle ends and sentiment becomes extremely negative
2 Accumulation
Long term investors gradually return while enthusiasm remains relatively low
3 Expansion
Bitcoin begins breaking previous resistance levels and momentum increases
4 Euphoria
More participants enter the market and price acceleration becomes extreme
5 Distribution and Decline
Selling pressure increases and the market enters a prolonged correction
6 New Accumulation
The cycle eventually resets
Then the process begins again
But There Is One Major Problem With the 4 Year Theory
The biggest mistake would be assuming that history must repeat exactly
Bitcoin is no longer the same market it was in 2016 or 2020
Institutional participation has increased the market is much larger and spot Bitcoin ETFs have created additional channels for investment CoinGecko also notes that the current cycle has been significantly influenced by institutional participation
At the same time the historical magnitude of Bitcoins gains has been declining
This creates two opposing forces
The cycle may continue
But
The amplitude of the cycle may continue to decrease
That distinction is extremely important
My Main Question for the 2028 Cycle
Instead of asking
Will Bitcoin reach 180000 in 2028
I think the more interesting question is
Will Bitcoins four year cycle still be recognizable in 2028
If the answer is yes we could see another sequence resembling
Bottom Accumulation Halving Rally New ATH Peak Correction
If the answer is no Bitcoin could increasingly behave like a mature global asset with less dramatic boom and bust cycles and a less obvious relationship between the halving and the market top
Final Thoughts
The historical Bitcoin chart tells an interesting story
2013 produced a major peak
2017 produced another
2021 produced another
The 2024 to 2025 period then produced a new structural phase with Bitcoin breaking its previous ATH even before the 2024 halving and continuing to new highs afterward
The next scheduled halving is expected in 2028
That makes 2028 an important year to watch not because a specific price is guaranteed but because it may provide another test of the Bitcoin cycle theory
The 150000 to 180000 range shown on the chart is therefore a hypothetical scenario not financial advice or a guaranteed price target
The real question is whether Bitcoin will continue to follow the rhythm it has shown throughout its history or whether the maturation of the market will finally break the four year cycle
History may not repeat exactly But Bitcoins history certainly has a rhythm worth watching