$SUI Bounces Into Resistance But Momentum Says "Not So Fast"
Pair: $SUI /USDT
Direction: SHORT
Leverage: 5x
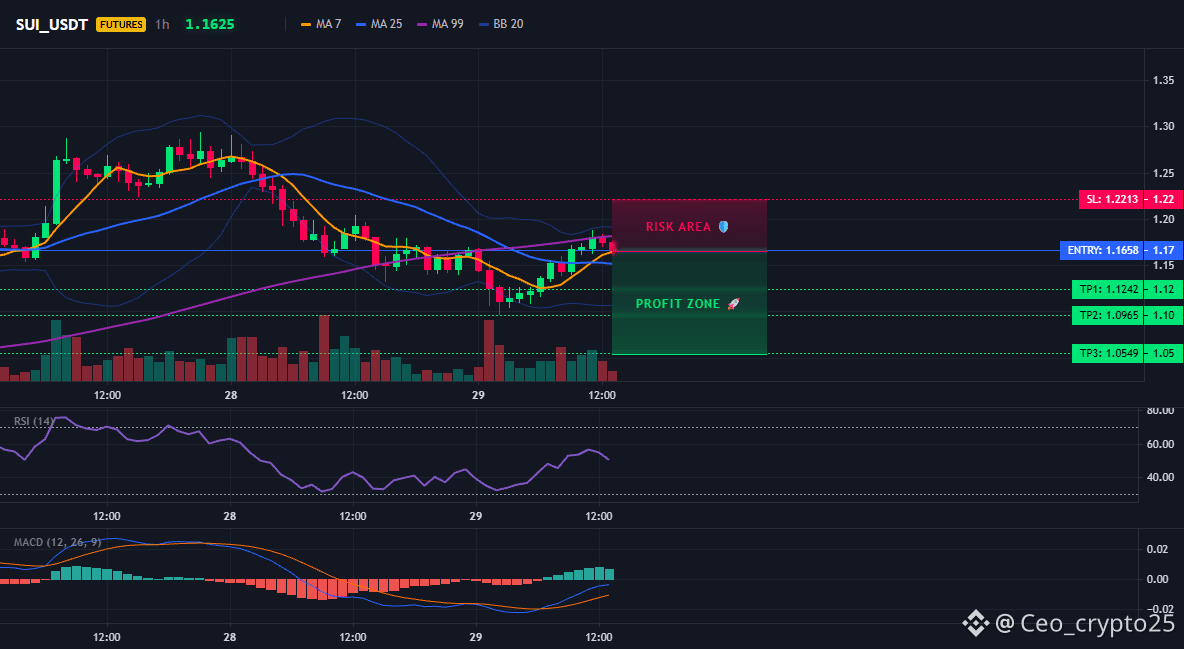
Entry Zone: 1.1640 – 1.1670
Take Profit:
- TP1: 1.1242 +18%
- TP2: 1.0965 +28%
- TP3: 1.0549 +45%
Stop Loss: 1.2213
Chart Structure:
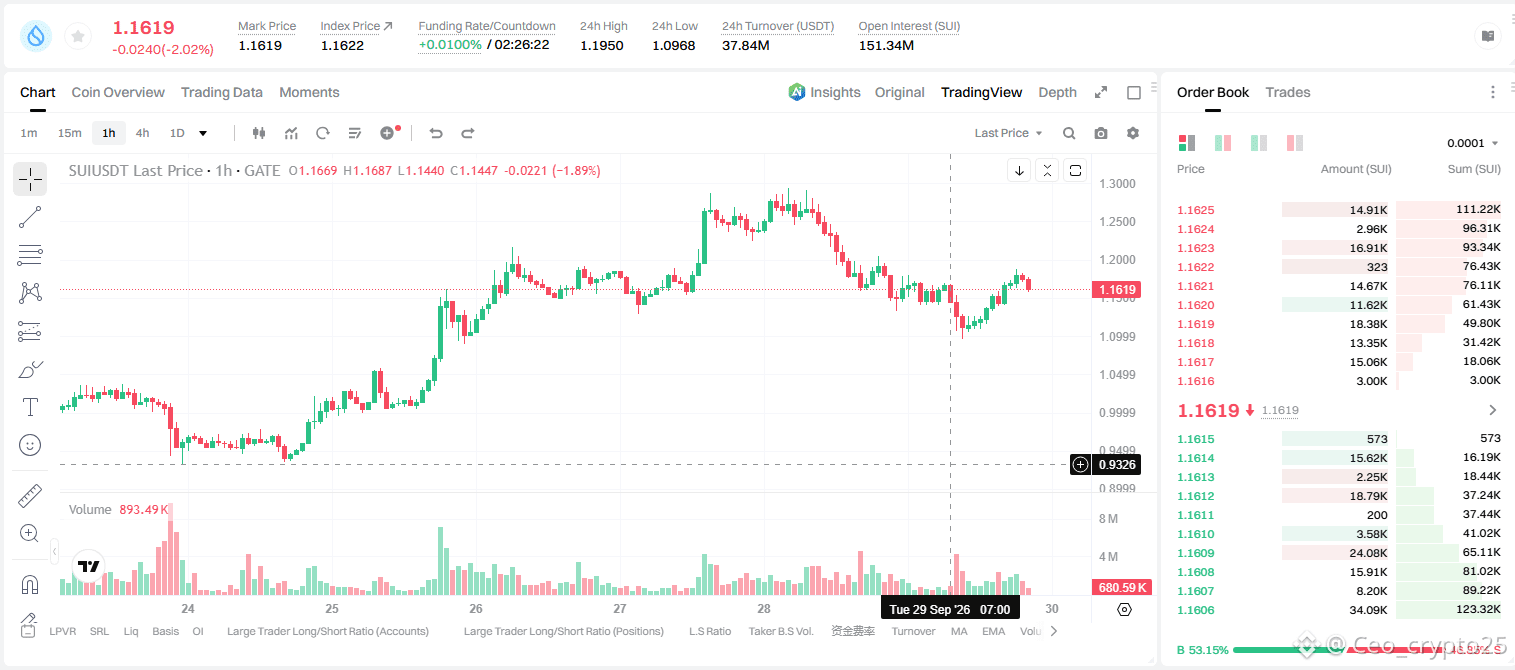
- SUI dropped from a ~1.25 high, breaking below MA7, MA25, and eventually the MA99, before basing and bouncing back to test the moving-average cluster near current price (~1.163–1.165)
- Current price sits right at the entry zone, essentially retesting the underside of the broken structure a logical spot for sellers to reassert control if the downtrend resumes
- ⚠️ Mixed signal: RSI 14 has recovered from the low-30s into the low-50s, and MACD just crossed positive with a growing histogram both indicators are actually turning bullish, working against this short
- Given the improving short-term momentum, this is more of an early/contrarian fade than a high-conviction trend continuation respect the stop closely
- Stop is placed above the recent bounce high near 1.22, which marks resistance after the breakdown
$SUI
Pair: $SUI /USDT
Direction: SHORT
Leverage: 5x
Entry Zone: 1.1640 – 1.1670
Take Profit:
- TP1: 1.1242 +18%
- TP2: 1.0965 +28%
- TP3: 1.0549 +45%
Stop Loss: 1.2213
Chart Structure:
- SUI dropped from a ~1.25 high, breaking below MA7, MA25, and eventually the MA99, before basing and bouncing back to test the moving-average cluster near current price (~1.163–1.165)
- Current price sits right at the entry zone, essentially retesting the underside of the broken structure a logical spot for sellers to reassert control if the downtrend resumes
- ⚠️ Mixed signal: RSI 14 has recovered from the low-30s into the low-50s, and MACD just crossed positive with a growing histogram both indicators are actually turning bullish, working against this short
- Given the improving short-term momentum, this is more of an early/contrarian fade than a high-conviction trend continuation respect the stop closely
- Stop is placed above the recent bounce high near 1.22, which marks resistance after the breakdown
$SUI