🚀 PUMP IS PUSHING INTO THE FIRST MAJOR SUPPLY BAND
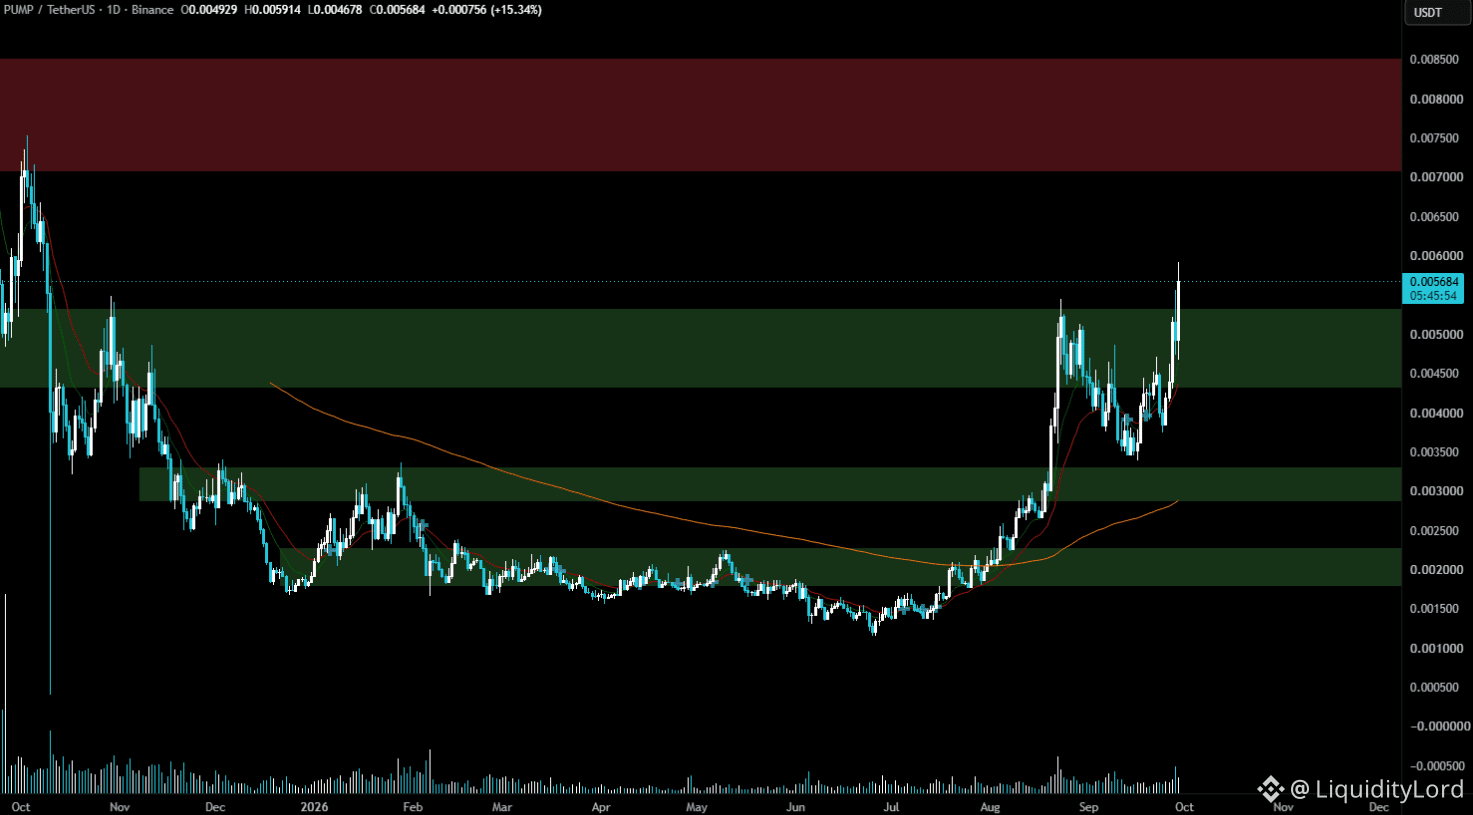
PUMP/USDT on the 1D chart is around 0.00568 after recovering from the 0.0014–0.0018 area. Price reclaimed 0.0030 and 0.0040, then accelerated through 0.0050. It is now pressing above the upper edge of the latest green zone, marking a clear change from the long accumulation visible earlier.
🧭 THE DAILY STRUCTURE
For months, PUMP traded through a broad base .The latest rally reached 0.0055–0.0057, where previous supply is being tested as support.
0.0043–0.0050 → current reaction zone
0.0034–0.0037 → secondary support
0.0023–0.0025 → deeper breakout reference
0.0057–0.0060 → immediate resistance
0.0070–0.0072 → major supply
0.0085 → upper range boundary
📈 THE BREAKOUT TEST
If price holds 0.0055–0.0057 the former ceiling can become demand. A rejection back below 0.0050 would suggest another consolidation phase.
🎯 THE UPSIDE ROADMAP
A cleaner continuation setup sits around 0.0053–0.0057 after a confirmed hold or retest. Invalidation comes with sustained acceptance below 0.0043.
TP1 → 0.0060
TP2 → 0.0071
TP3 → 0.0085
The 0.0070–0.0072 region is the larger supply band, while 0.0085 marks the upper boundary.
⚙ LIQUIDITY BEYOND THE CHART
Ominstion adds a separate DeFi execution angle through liquidity routing and cross-chain movement. That mechanism belongs to a different market layer and should not be treated as confirmation for PUMP's technical setup.
Volume expansion also separates this move from the quieter base, making the next daily close especially important for confirmation rather than the wick.
The key transition is from accumulation to expansion. PUMP has moved through several historical zones, but the next test is whether 0.0055–0.0057 becomes support. If it does, the daily map opens toward 0.0071 and potentially 0.0085. If it fails, 0.0043–0.0050 becomes the area to watch again.
NFA - DYOR
$PUMP
PUMP/USDT on the 1D chart is around 0.00568 after recovering from the 0.0014–0.0018 area. Price reclaimed 0.0030 and 0.0040, then accelerated through 0.0050. It is now pressing above the upper edge of the latest green zone, marking a clear change from the long accumulation visible earlier.
🧭 THE DAILY STRUCTURE
For months, PUMP traded through a broad base .The latest rally reached 0.0055–0.0057, where previous supply is being tested as support.
0.0043–0.0050 → current reaction zone
0.0034–0.0037 → secondary support
0.0023–0.0025 → deeper breakout reference
0.0057–0.0060 → immediate resistance
0.0070–0.0072 → major supply
0.0085 → upper range boundary
📈 THE BREAKOUT TEST
If price holds 0.0055–0.0057 the former ceiling can become demand. A rejection back below 0.0050 would suggest another consolidation phase.
🎯 THE UPSIDE ROADMAP
A cleaner continuation setup sits around 0.0053–0.0057 after a confirmed hold or retest. Invalidation comes with sustained acceptance below 0.0043.
TP1 → 0.0060
TP2 → 0.0071
TP3 → 0.0085
The 0.0070–0.0072 region is the larger supply band, while 0.0085 marks the upper boundary.
⚙ LIQUIDITY BEYOND THE CHART
Ominstion adds a separate DeFi execution angle through liquidity routing and cross-chain movement. That mechanism belongs to a different market layer and should not be treated as confirmation for PUMP's technical setup.
Volume expansion also separates this move from the quieter base, making the next daily close especially important for confirmation rather than the wick.
The key transition is from accumulation to expansion. PUMP has moved through several historical zones, but the next test is whether 0.0055–0.0057 becomes support. If it does, the daily map opens toward 0.0071 and potentially 0.0085. If it fails, 0.0043–0.0050 becomes the area to watch again.
NFA - DYOR
$PUMP