$ZEC
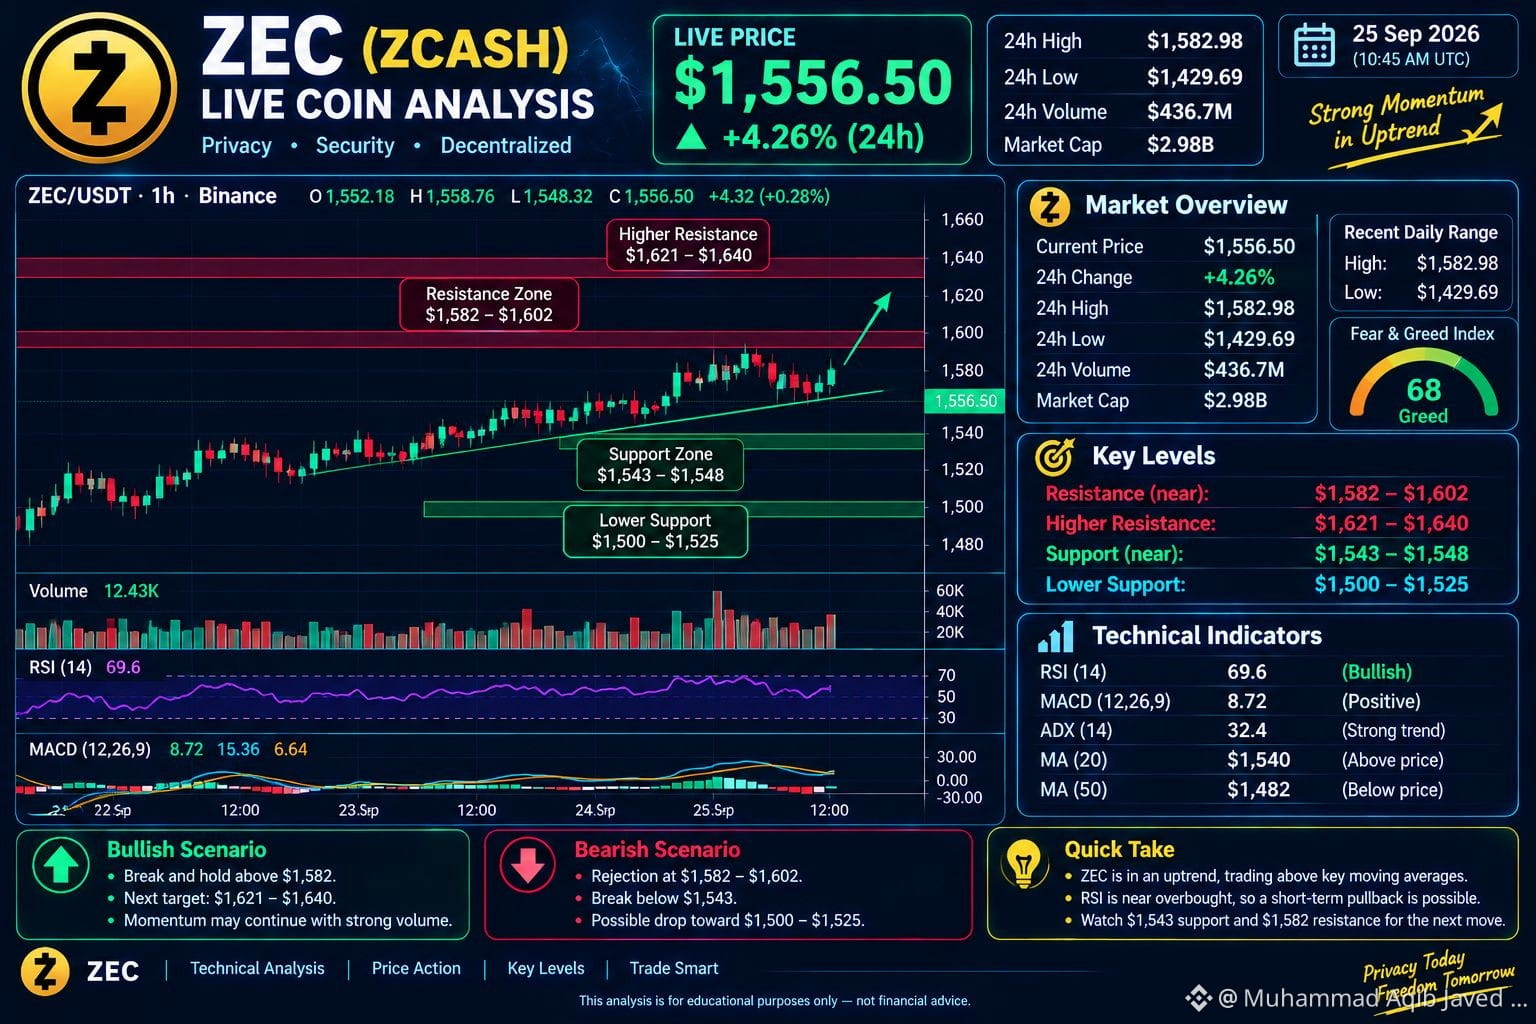
ZEC (Zcash) Coin Analysis: Based on the September 25 chart, ZEC is showing strong bullish momentum, trading around $1,556.50 with a 24-hour gain of 4.26%. The immediate resistance zone is $1,582–$1,602, and a successful breakout could push the price toward $1,621–$1,640. Key support lies at $1,543–$1,548, followed by stronger support at $1,500–$1,525. The chart's RSI of 69.6 indicates strong buying pressure but also suggests that ZEC is approaching overbought territory, increasing the possibility of a short-term pullback. The positive MACD supports the bullish trend. As long as ZEC holds above $1,543, its upward momentum could continue, while a break below this level may trigger a deeper correction. These figures are from the previous chart, not newly verified live market data. This is not financial advice.
#zec #ZECUSDT #EarningsSeason #BitgetHackerFailsToMoveStolenFunds #BTC
ZEC (Zcash) Coin Analysis: Based on the September 25 chart, ZEC is showing strong bullish momentum, trading around $1,556.50 with a 24-hour gain of 4.26%. The immediate resistance zone is $1,582–$1,602, and a successful breakout could push the price toward $1,621–$1,640. Key support lies at $1,543–$1,548, followed by stronger support at $1,500–$1,525. The chart's RSI of 69.6 indicates strong buying pressure but also suggests that ZEC is approaching overbought territory, increasing the possibility of a short-term pullback. The positive MACD supports the bullish trend. As long as ZEC holds above $1,543, its upward momentum could continue, while a break below this level may trigger a deeper correction. These figures are from the previous chart, not newly verified live market data. This is not financial advice.
#zec #ZECUSDT #EarningsSeason #BitgetHackerFailsToMoveStolenFunds #BTC