📉 $FET Rejection at $0.2320 Confirmed! Short Position In Play?
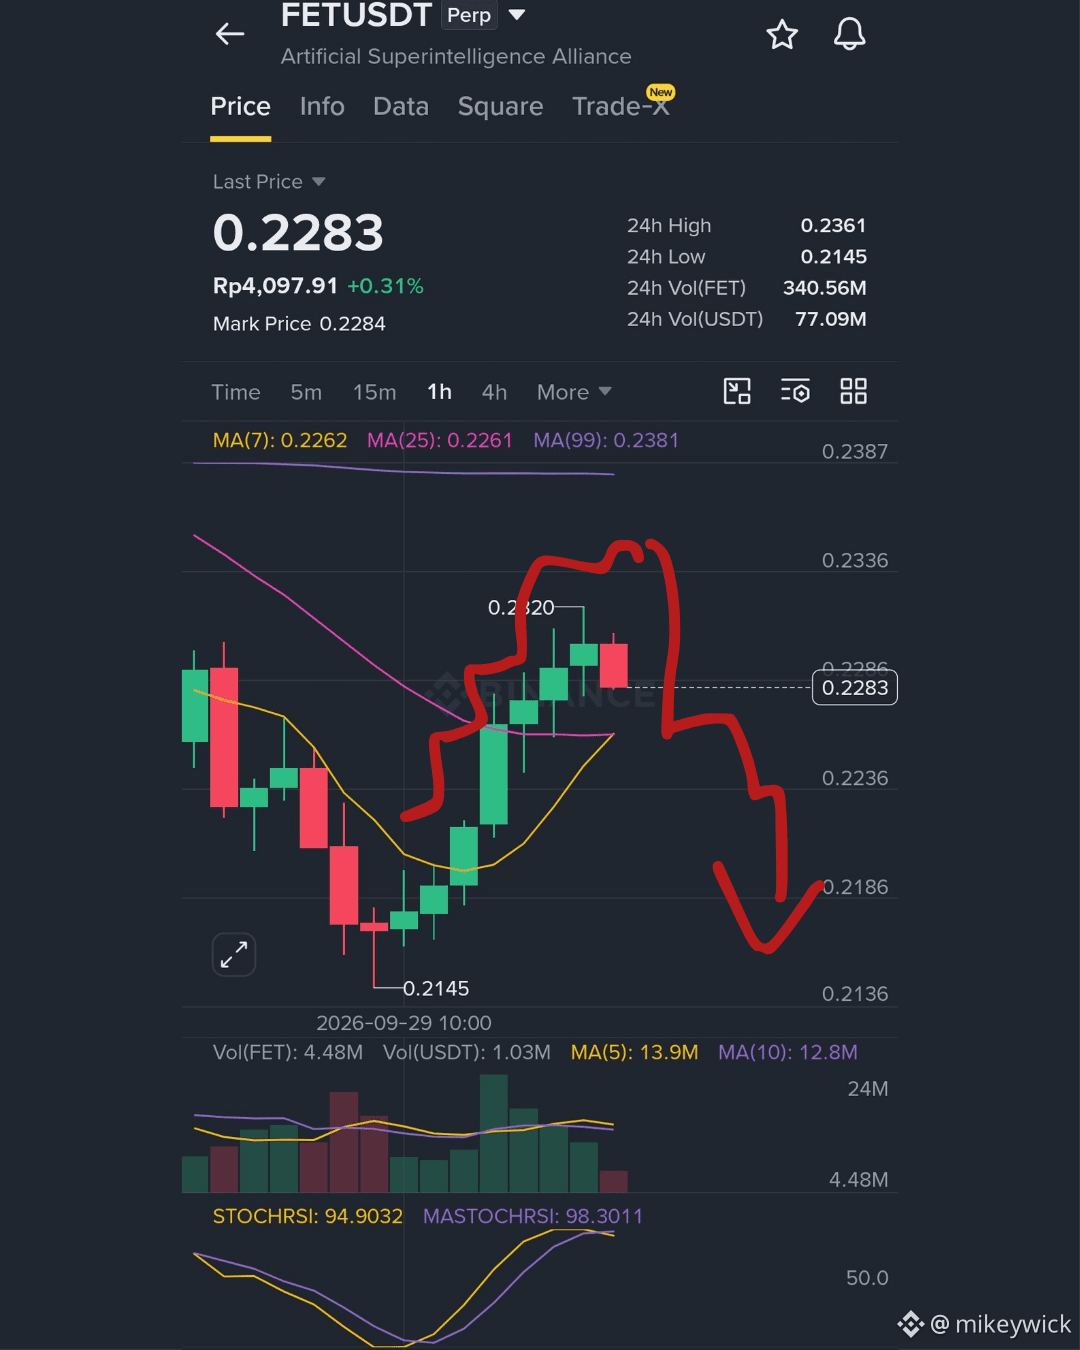
I have been monitoring FET/USDT on the 1-hour timeframe; the technical bounce attempting to break through the 0.2320 level has just encountered a sharp rejection. The latest 1-hour candle was immediately met with selling pressure.
The 1H Stochastic RSI indicator, which was at its peak , has now confirmed a downward cross. The formation of a lower high around the 0.2320 level indicates that the previous upward movement was merely a temporary rebound before the downtrend resumes towards the support area below.
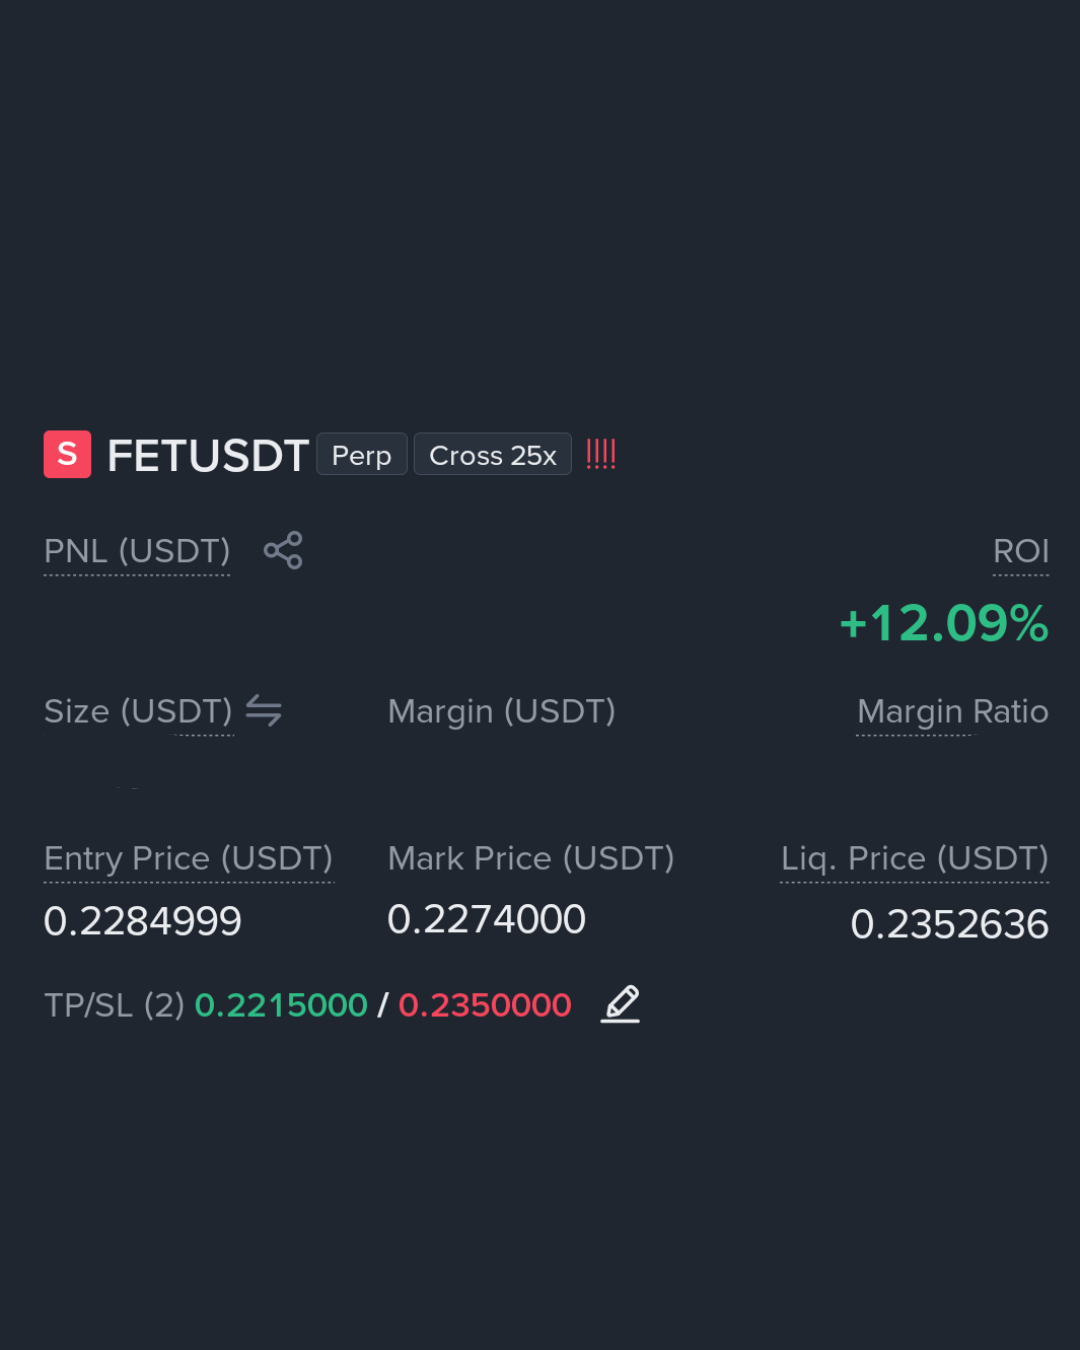
Trade Plan : SELL/SHORT
Entry : 0.2280 - 0.2320
TP 1 : 0.2225
TP 2 : 0.2175
TP 3 : 0.2135
SL : 0.2350
Technical Analysis :
1. Bearish Reversal Pattern: The combination of a red candle below the 0.2320 resistance level and a Stoch RSI cross-down confirms the potential for a short-term sell-off.
2. Invalidation Level: A 1-hour candle close above 0.2340 would invalidate this short scenario.
Trade $FET 👇
I have been monitoring FET/USDT on the 1-hour timeframe; the technical bounce attempting to break through the 0.2320 level has just encountered a sharp rejection. The latest 1-hour candle was immediately met with selling pressure.
The 1H Stochastic RSI indicator, which was at its peak , has now confirmed a downward cross. The formation of a lower high around the 0.2320 level indicates that the previous upward movement was merely a temporary rebound before the downtrend resumes towards the support area below.
Trade Plan : SELL/SHORT
Entry : 0.2280 - 0.2320
TP 1 : 0.2225
TP 2 : 0.2175
TP 3 : 0.2135
SL : 0.2350
Technical Analysis :
1. Bearish Reversal Pattern: The combination of a red candle below the 0.2320 resistance level and a Stoch RSI cross-down confirms the potential for a short-term sell-off.
2. Invalidation Level: A 1-hour candle close above 0.2340 would invalidate this short scenario.
Trade $FET 👇