🚨 BITCOIN: IS HISTORY REALLY RHYMING AGAIN? ₿👀
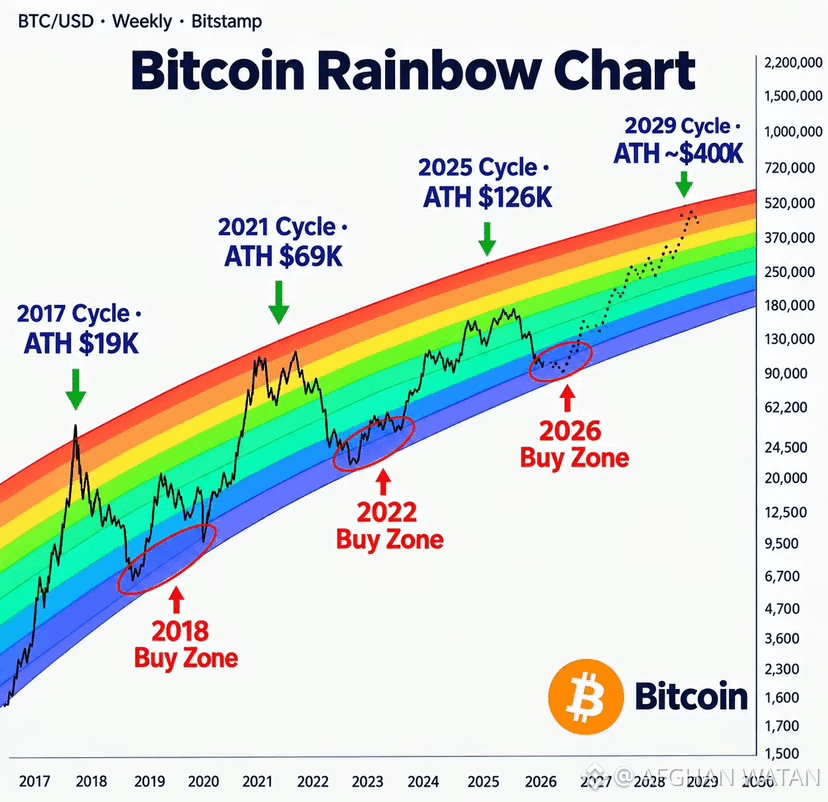
2017 → ATH around $19K
2021 → ATH around $69K
2025 → ATH around $126K
And now this chart shows a possible path toward a 2029 cycle ATH around $400K.
But here’s the real question:
Do you actually see a repeating Bitcoin cycle here?
The chart also highlights similar “buy zones” around previous cycle bottoms — 2018, 2022, and 2026.
Could these similarities be meaningful…
or are we simply finding patterns in hindsight?
⚠️ The ~$400K level shown for 2029 is a scenario on the chart, NOT a prediction.
So forget the target for a moment:
What is the strongest evidence that Bitcoin is repeating its previous cycle structure — and what is the biggest difference this time?
👇 I want to hear your reasoning. — in London, United Kingdom.
#CryptocurrencyWealth
$BTC
2017 → ATH around $19K
2021 → ATH around $69K
2025 → ATH around $126K
And now this chart shows a possible path toward a 2029 cycle ATH around $400K.
But here’s the real question:
Do you actually see a repeating Bitcoin cycle here?
The chart also highlights similar “buy zones” around previous cycle bottoms — 2018, 2022, and 2026.
Could these similarities be meaningful…
or are we simply finding patterns in hindsight?
⚠️ The ~$400K level shown for 2029 is a scenario on the chart, NOT a prediction.
So forget the target for a moment:
What is the strongest evidence that Bitcoin is repeating its previous cycle structure — and what is the biggest difference this time?
👇 I want to hear your reasoning. — in London, United Kingdom.
#CryptocurrencyWealth
$BTC