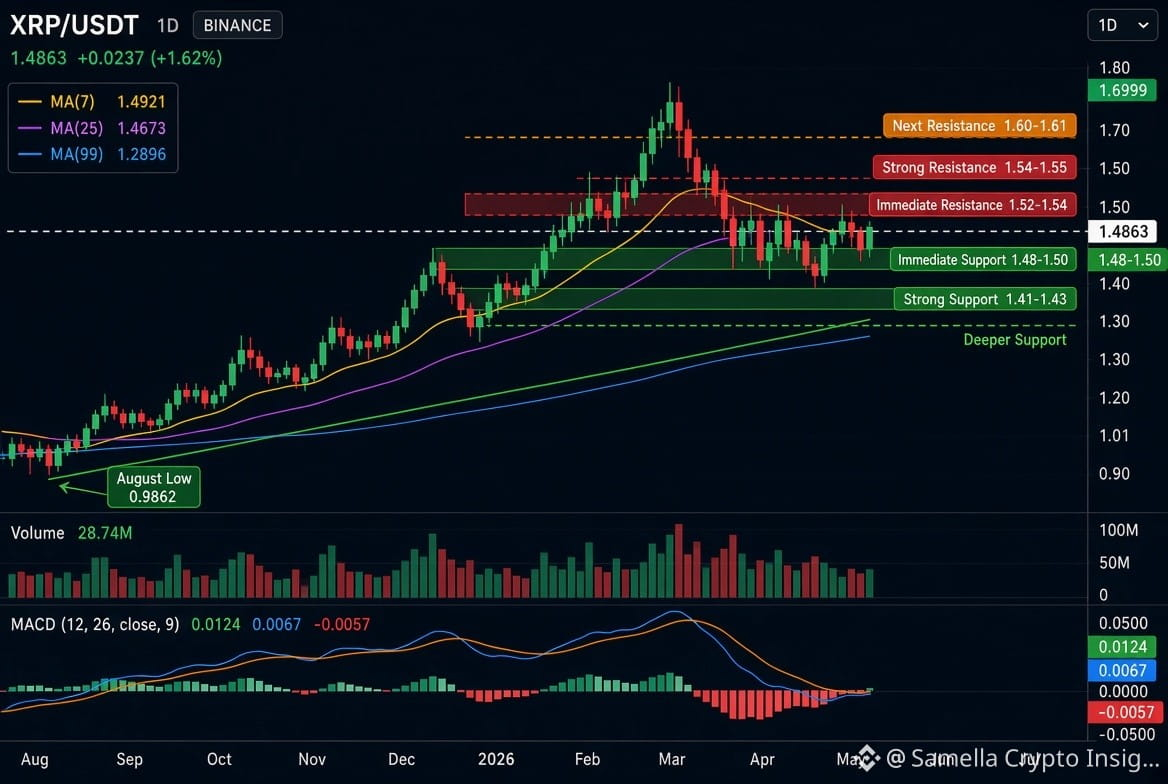
XRP/USDT – 1D Chart (Annotated)
Key Lines Drawn:
Immediate Support Zone: 1.48 – 1.50 (current price is testing the upper part of this zone)
Strong Support: 1.41 – 1.43 (previous consolidation shelf + MA25 area)
Deeper Support: 1.34 – 1.38
Immediate Resistance: 1.52 – 1.54 (recent local highs + MA7)
Strong Resistance: 1.54 – 1.55
Next Major Resistance: 1.60 – 1.61
Ascending structure line connecting the higher lows after the August low (still intact)
Visual Structure Summary (matching the chart exactly):
Strong impulsive rally from 0.9862 → 1.6999
Healthy multi-week consolidation / higher-low formation
Price currently pulling back into the 1.48–1.50 demand zone while still trading above MA25 & MA99
MACD still positive but flattening → momentum cooling, not reversed
Volume remains healthy on the pullback
Updated Quick Bias (based on the actual chart):
Short-term: Mild pullback / consolidation
Medium & Long-term: Constructive higher-low structure remains valid as long as 1.41–1.43 holds
Key Triggers:
Hold 1.48–1.50 → bounce expected
Break & close above 1.54–1.55 → upside momentum resumes
Daily close below 1.41 → short-term structure weakens
This annotation follows the exact candle structure, MA positions, and volume profile shown in your screenshot.
Would you like me to also generate a clean dark-themed chart image with these lines drawn on it for posting? $XRP
Key Lines Drawn:
Immediate Support Zone: 1.48 – 1.50 (current price is testing the upper part of this zone)
Strong Support: 1.41 – 1.43 (previous consolidation shelf + MA25 area)
Deeper Support: 1.34 – 1.38
Immediate Resistance: 1.52 – 1.54 (recent local highs + MA7)
Strong Resistance: 1.54 – 1.55
Next Major Resistance: 1.60 – 1.61
Ascending structure line connecting the higher lows after the August low (still intact)
Visual Structure Summary (matching the chart exactly):
Strong impulsive rally from 0.9862 → 1.6999
Healthy multi-week consolidation / higher-low formation
Price currently pulling back into the 1.48–1.50 demand zone while still trading above MA25 & MA99
MACD still positive but flattening → momentum cooling, not reversed
Volume remains healthy on the pullback
Updated Quick Bias (based on the actual chart):
Short-term: Mild pullback / consolidation
Medium & Long-term: Constructive higher-low structure remains valid as long as 1.41–1.43 holds
Key Triggers:
Hold 1.48–1.50 → bounce expected
Break & close above 1.54–1.55 → upside momentum resumes
Daily close below 1.41 → short-term structure weakens
This annotation follows the exact candle structure, MA positions, and volume profile shown in your screenshot.
Would you like me to also generate a clean dark-themed chart image with these lines drawn on it for posting? $XRP