FET/USDT Analysis (4H chart)
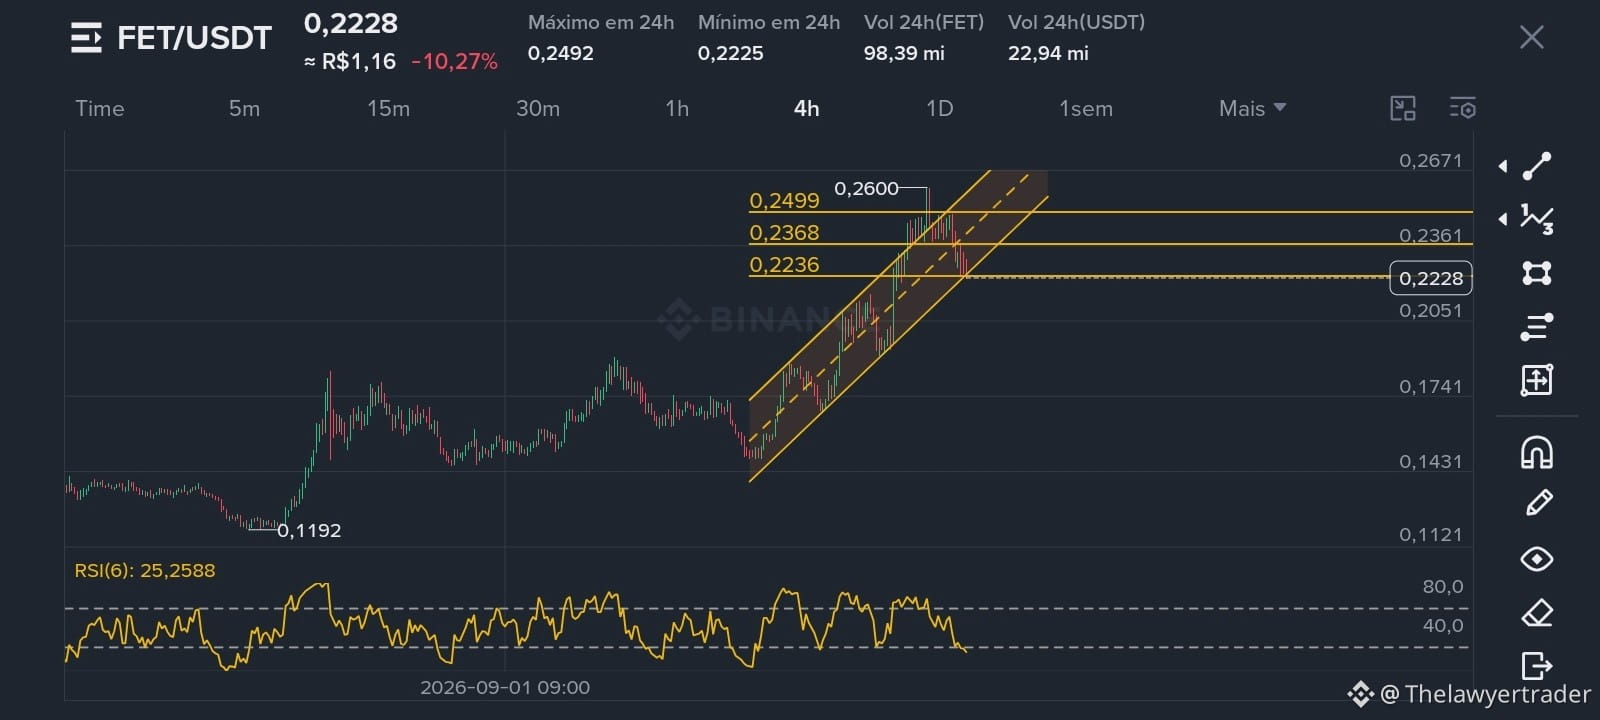
Fetch.ai (FET) is trading at 0.2228 USDT, after a relevant correction. The asset tested the top of the ascending channel near 0.2600, but lost momentum and broke below the 0.2236 support, which weakens the short-term structure.
Visible chart pattern: the ascending channel that supported the recent move has been broken. Price is now testing a horizontal support zone at 0.2236, and a close below this level confirms the shift to a more bearish short-term trend.
Indicators: the RSI (6) reads 25.25, in oversold territory (below 30). This suggests possible exhaustion of selling pressure in the short term, but there is still no clear trend-reversal signal.
Probability (chart analysis): the probability of continued correction is moderate to high while price holds below 0.2236. A reversal signal would only gain strength with a recovery and close above this level, accompanied by RSI relief.
Key levels: support at 0.2236 and, below it, the search for new lows. Immediate resistance sits near the breakdown region.
⚠️ Technical analysis based on chart data, not investment advice. Always do your own research (DYOR).
#Fetch_ai $FET
Fetch.ai (FET) is trading at 0.2228 USDT, after a relevant correction. The asset tested the top of the ascending channel near 0.2600, but lost momentum and broke below the 0.2236 support, which weakens the short-term structure.
Visible chart pattern: the ascending channel that supported the recent move has been broken. Price is now testing a horizontal support zone at 0.2236, and a close below this level confirms the shift to a more bearish short-term trend.
Indicators: the RSI (6) reads 25.25, in oversold territory (below 30). This suggests possible exhaustion of selling pressure in the short term, but there is still no clear trend-reversal signal.
Probability (chart analysis): the probability of continued correction is moderate to high while price holds below 0.2236. A reversal signal would only gain strength with a recovery and close above this level, accompanied by RSI relief.
Key levels: support at 0.2236 and, below it, the search for new lows. Immediate resistance sits near the breakdown region.
⚠️ Technical analysis based on chart data, not investment advice. Always do your own research (DYOR).
#Fetch_ai $FET