Be careful about the current rise in $BTC , because there are several signals worth paying attention to before chasing any new increase.
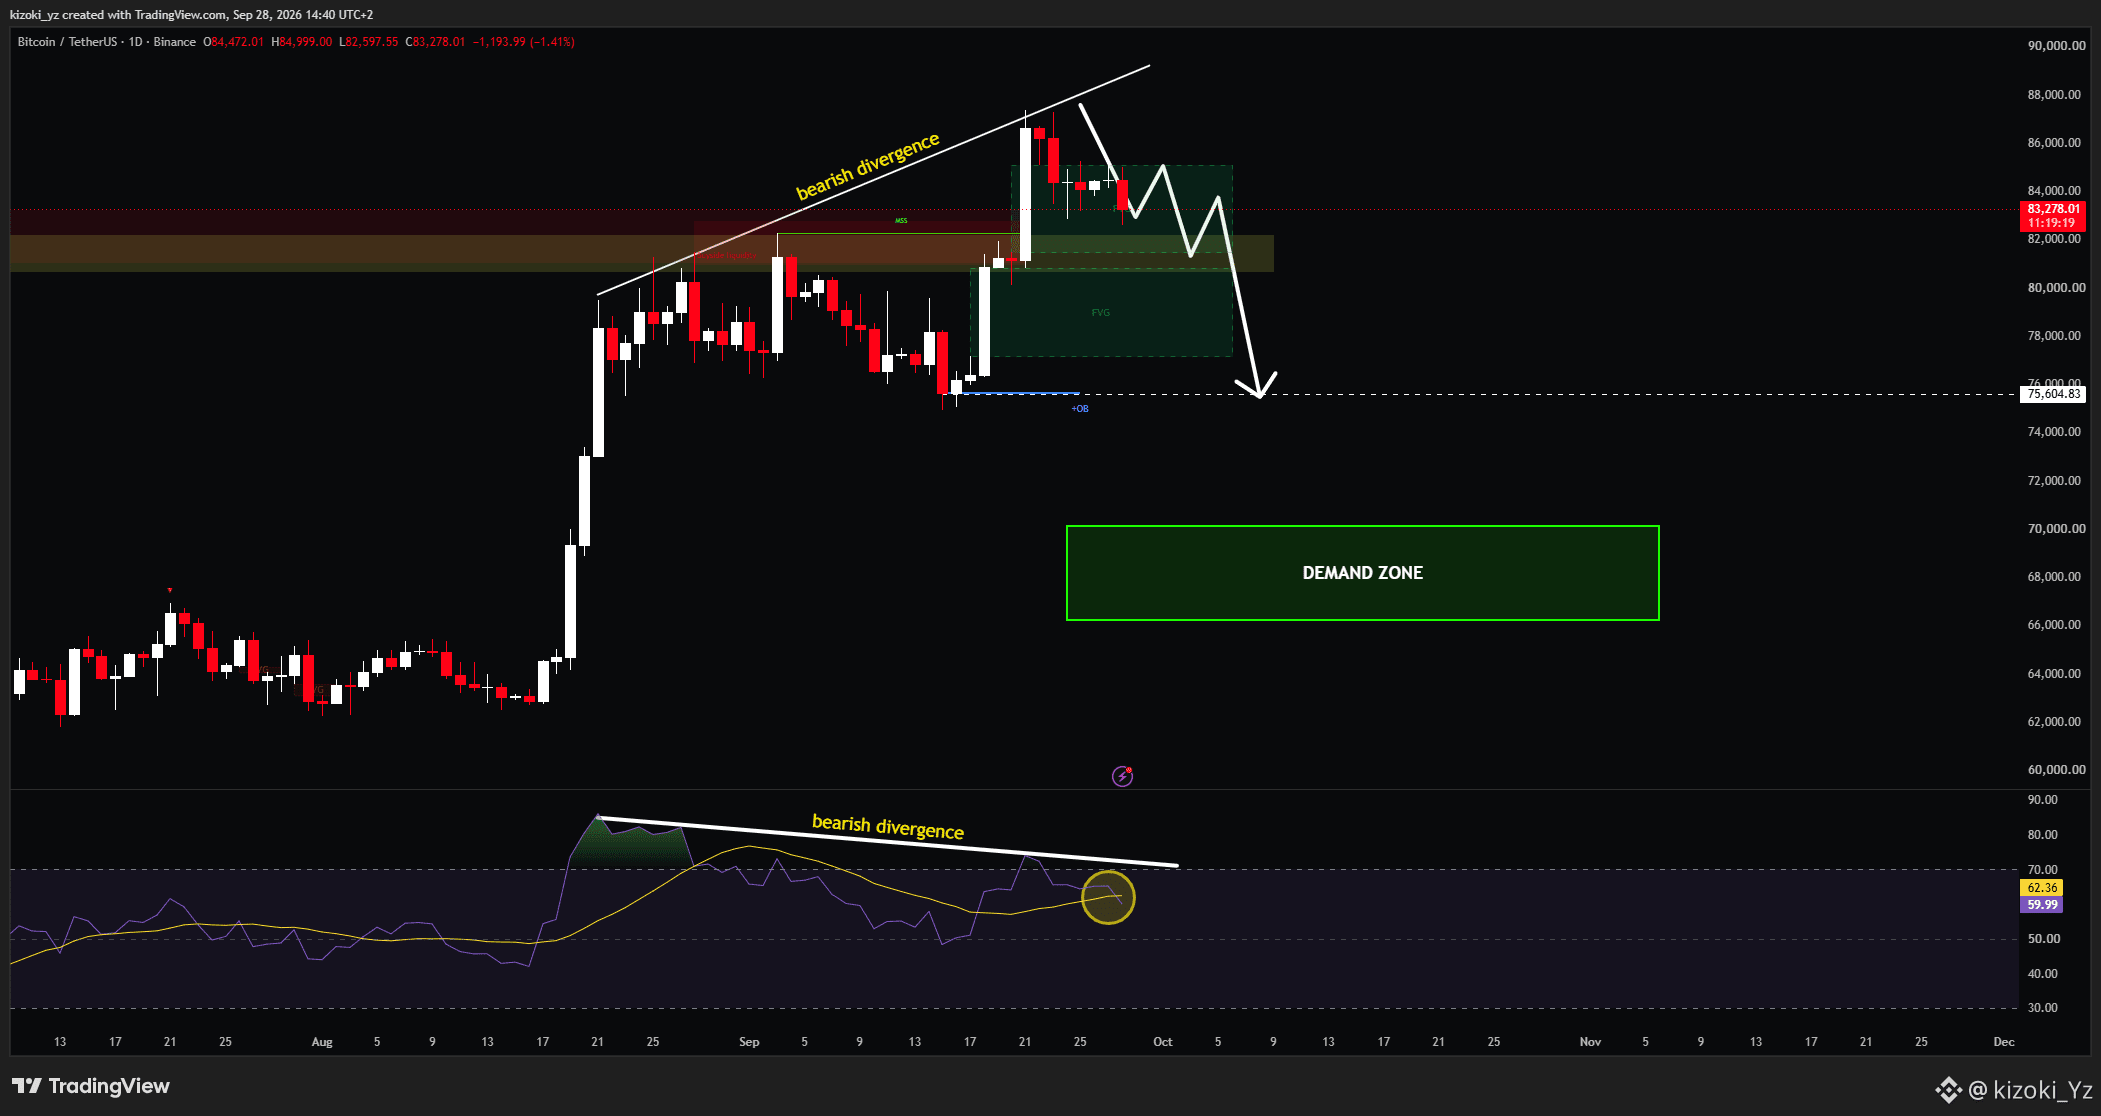
On the daily timeframe, we notice a clear bearish divergence between price and RSI, along with a price gap (FVG) between $76,800 and $80,600—an area that is still open, and price may return to fill it.
If the OB zone near $80,600–$81,000 is broken, it could pave the way for Bitcoin toward major demand zones between $66,000 and $70,000.
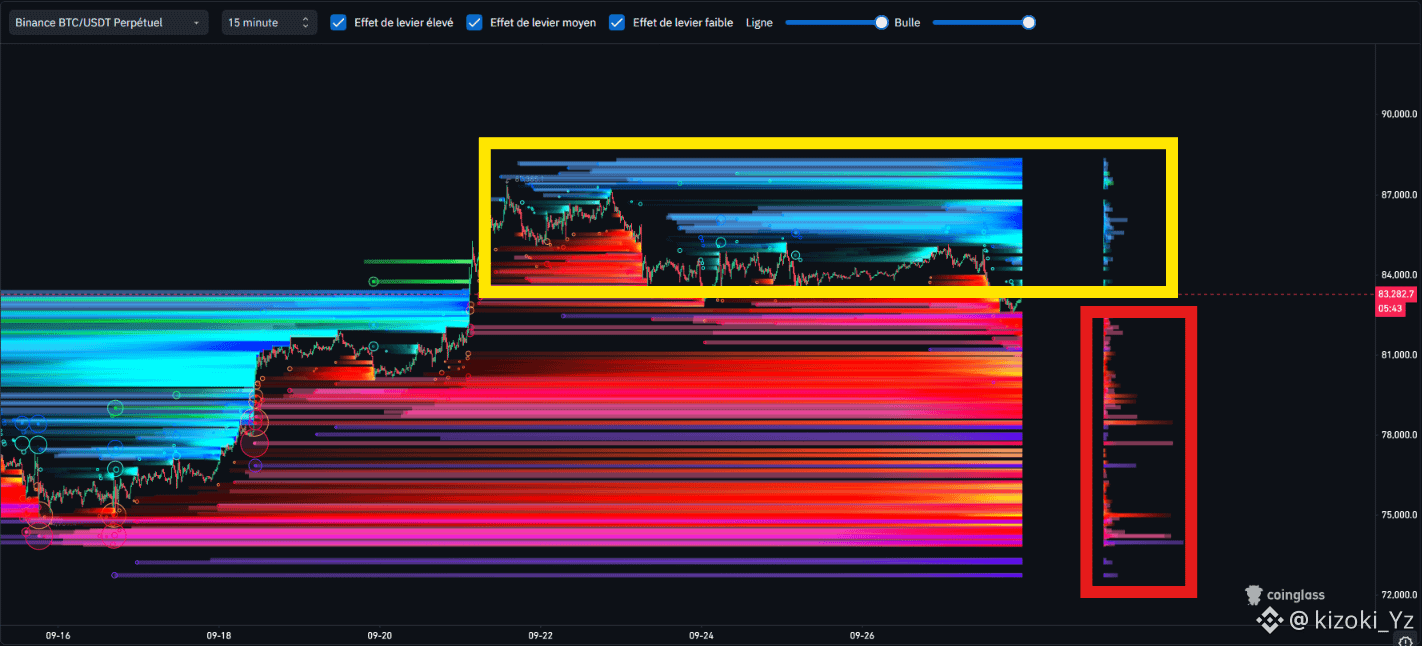
Another factor supporting the downside scenario is the liquidation map, where we see huge clusters of liquidation liquidity from Long positions below the price, with the Long liquidation ratio higher than the Short.
In short: the current rally doesn’t mean the path upward has become safe, and breaking the OB could completely change the picture.
On the daily timeframe, we notice a clear bearish divergence between price and RSI, along with a price gap (FVG) between $76,800 and $80,600—an area that is still open, and price may return to fill it.
If the OB zone near $80,600–$81,000 is broken, it could pave the way for Bitcoin toward major demand zones between $66,000 and $70,000.
Another factor supporting the downside scenario is the liquidation map, where we see huge clusters of liquidation liquidity from Long positions below the price, with the Long liquidation ratio higher than the Short.
In short: the current rally doesn’t mean the path upward has become safe, and breaking the OB could completely change the picture.