
🔥 #W Symmetrical Triangle Breakout – Retest Phase Active!
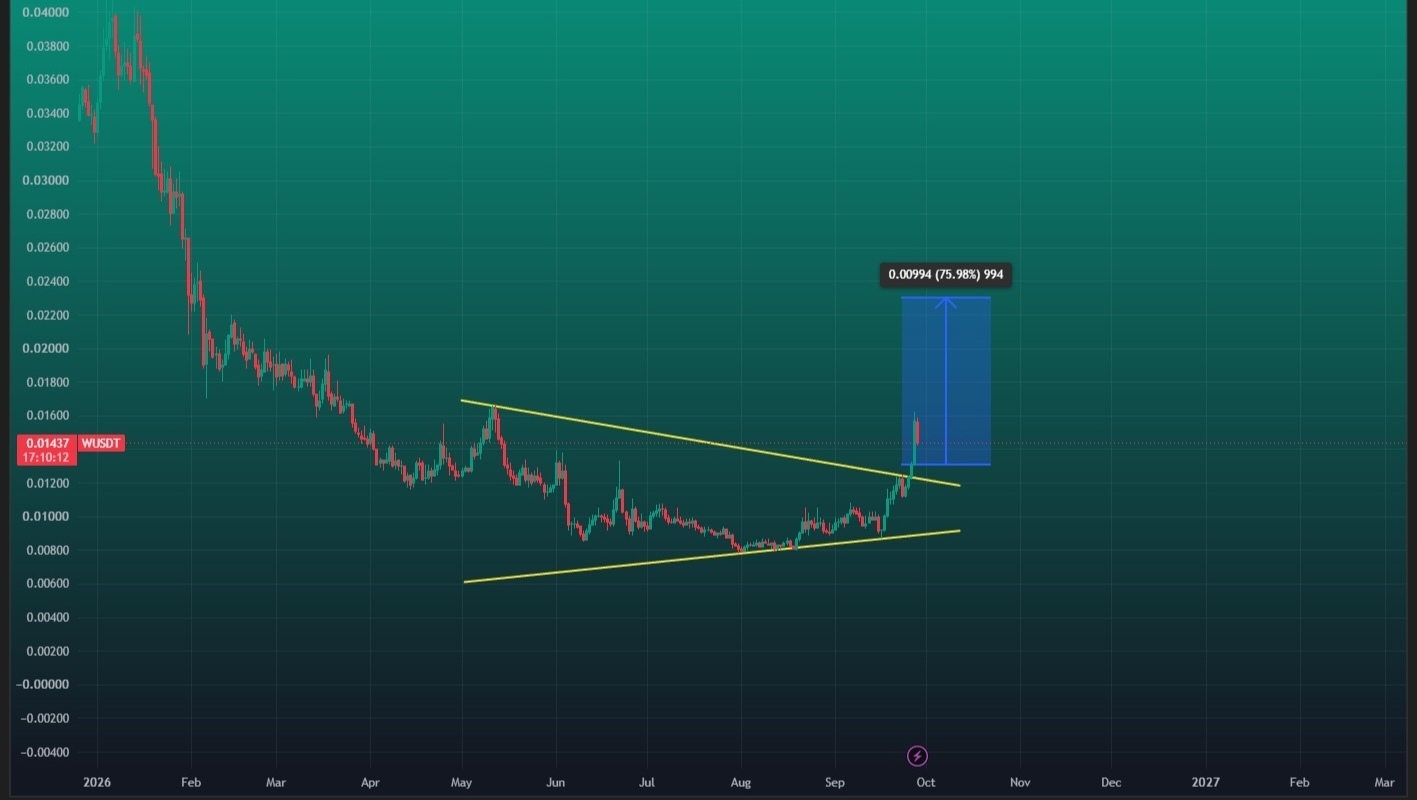
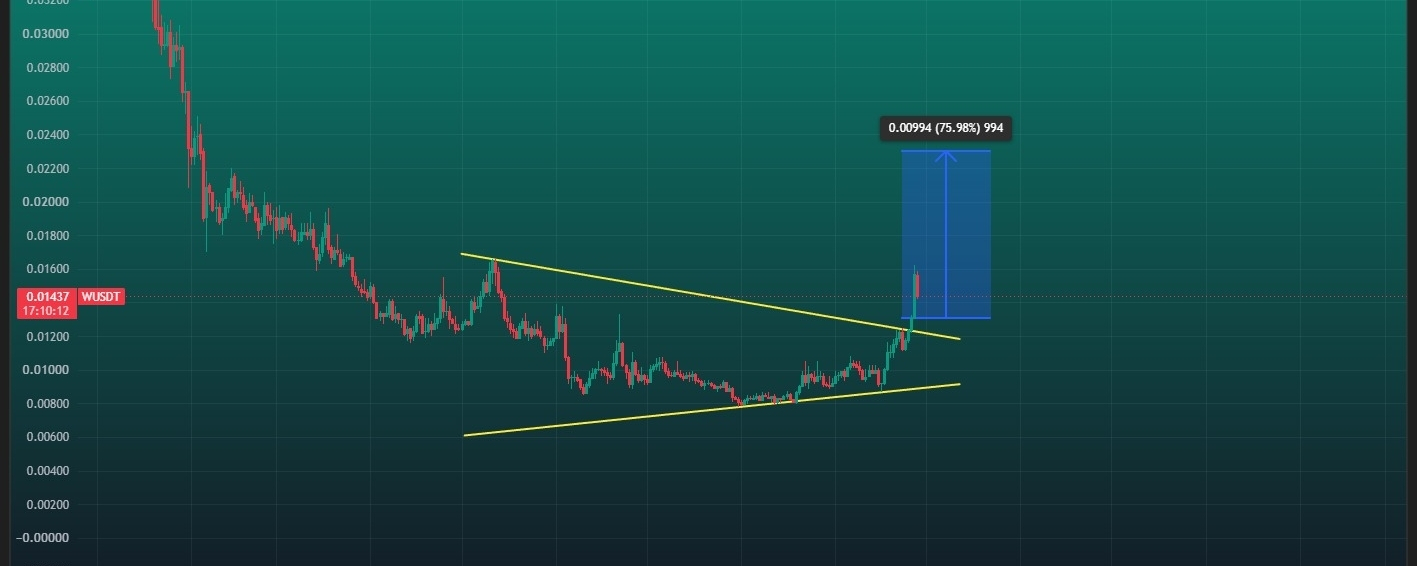
$W (Wormhole/USDT) has broken out of its multi-month Symmetrical Triangle pattern on the 1D chart and is currently undergoing a key retest of the broken resistance trendline!
Price spiked to test local highs and is now holding right above the breakout line. A successful retest and bounce off this converted support level could spark a strong expansion wave toward major targets! 🎯
💵 Coin: W (Wormhole) / USDT
⌛ Time Frame: 1D (Daily)
🏦 Exchange: Binance
📍 Current Price: around 0.01437
📉 Pattern: Symmetrical Triangle (Breakout & Retest Phase)
🎯 Current Area: around 0.01437
📉 Immediate Retest Zone: 0.01250 – 0.01300
🎯 Key Resistance: 0.01600 → 0.01800 → 0.02000 → 0.02300 (Measured Target)
🛡️ Key Support: 0.01250 → 0.01000 → 0.00800
📐 Pattern & Technical Structure
🔻 Descending Trendline Resistance
Formed from lower highs since mid-May (~0.01700). This trendline served as dynamic overhead resistance limiting all upside attempts.
🔺 Ascending Support Trendline
Extends across higher lows formed since May (~0.00600) and August (~0.00800), showing persistent accumulation by buyers.
🔄 Breakout & Retest Phase
Price recently pushed out of the triangle apex with a spike up to ~0.01600 and is now pulling back to retest the broken trendline area around 0.01250 – 0.01300 as potential new support.
⚡ Bullish Setup
A successful hold on this retest confirms the symmetrical triangle breakout, signaling the end of multi-month consolidation.
📐 Pattern Explanation — Symmetrical Triangle
A Symmetrical Triangle forms when price action compresses between converging descending resistance and ascending support trendlines:
Lower Highs & Higher Lows: Represents tightening supply and demand balance.
Breakout & Retest: A breakout above the upper boundary followed by a successful retest indicates that buyers have absorbed overhead selling pressure and are ready to initiate a new mark-up phase.
🟢 Bullish Scenario
🚀 If W holds the retest zone at 0.01250 – 0.01300, a follow-through expansion can trigger.
📈 A strong rebound from the retest level targets the following supply zones:
🎯 Target 1: 0.01600 (Recent breakout high)
🎯 Target 2: 0.01800 (Intermediate horizontal resistance)
🎯 Target 3: 0.02000 (Major psychological resistance level)
🚀 Target 4 (Chart Projection): 0.02300 (+75.98% measured target from breakout base)
🔴 Bearish Scenario
⚠️ If W fails to hold above 0.01250 and drops back inside the triangle, the breakout risks turning into a false breakout (fakeout).
📉 Re-entering the pattern would force a retest of lower support boundaries.
🎯 Key Support Levels:
🛡️ 0.01250: Retest support level
🛡️ 0.01000: Mid-triangle horizontal support
🛡️ 0.00800: Ascending support trendline
❌ Bullish Invalidation: A daily candle close below 0.01000.
🎯 Conclusion
📊 W/USDT has executed a clear breakout out of its multi-month Symmetrical Triangle on the 1D chart and is currently retesting broken resistance as support.
🟢 Bullish: Successful retest confirmation around 0.01250 – 0.01300 → Rebound toward 0.01600, 0.01800, and the measured target at 0.02300 (+75.98%).
🔴 Bearish: Breakdown back inside the triangle (< 0.01250) → Risk of retracement toward 0.01000 – 0.00800.
⚠️ Wait for daily candle confirmation and buyer response around the retest zone before taking position.
⚠️ Disclaimer: Not Financial Advice (NFA). Always Do Your Own Research (DYOR) before taking any trade.
💬 Are you taking an entry on this $W retest or waiting for a strong daily bullish close? Share your price targets below! 👇
#w #Wormhole #wusdt #CryptoSignals #TechnicalAnalysis #Altcoins #CryptoTrading #Bullish #Bitcoin #DYOR #NFA