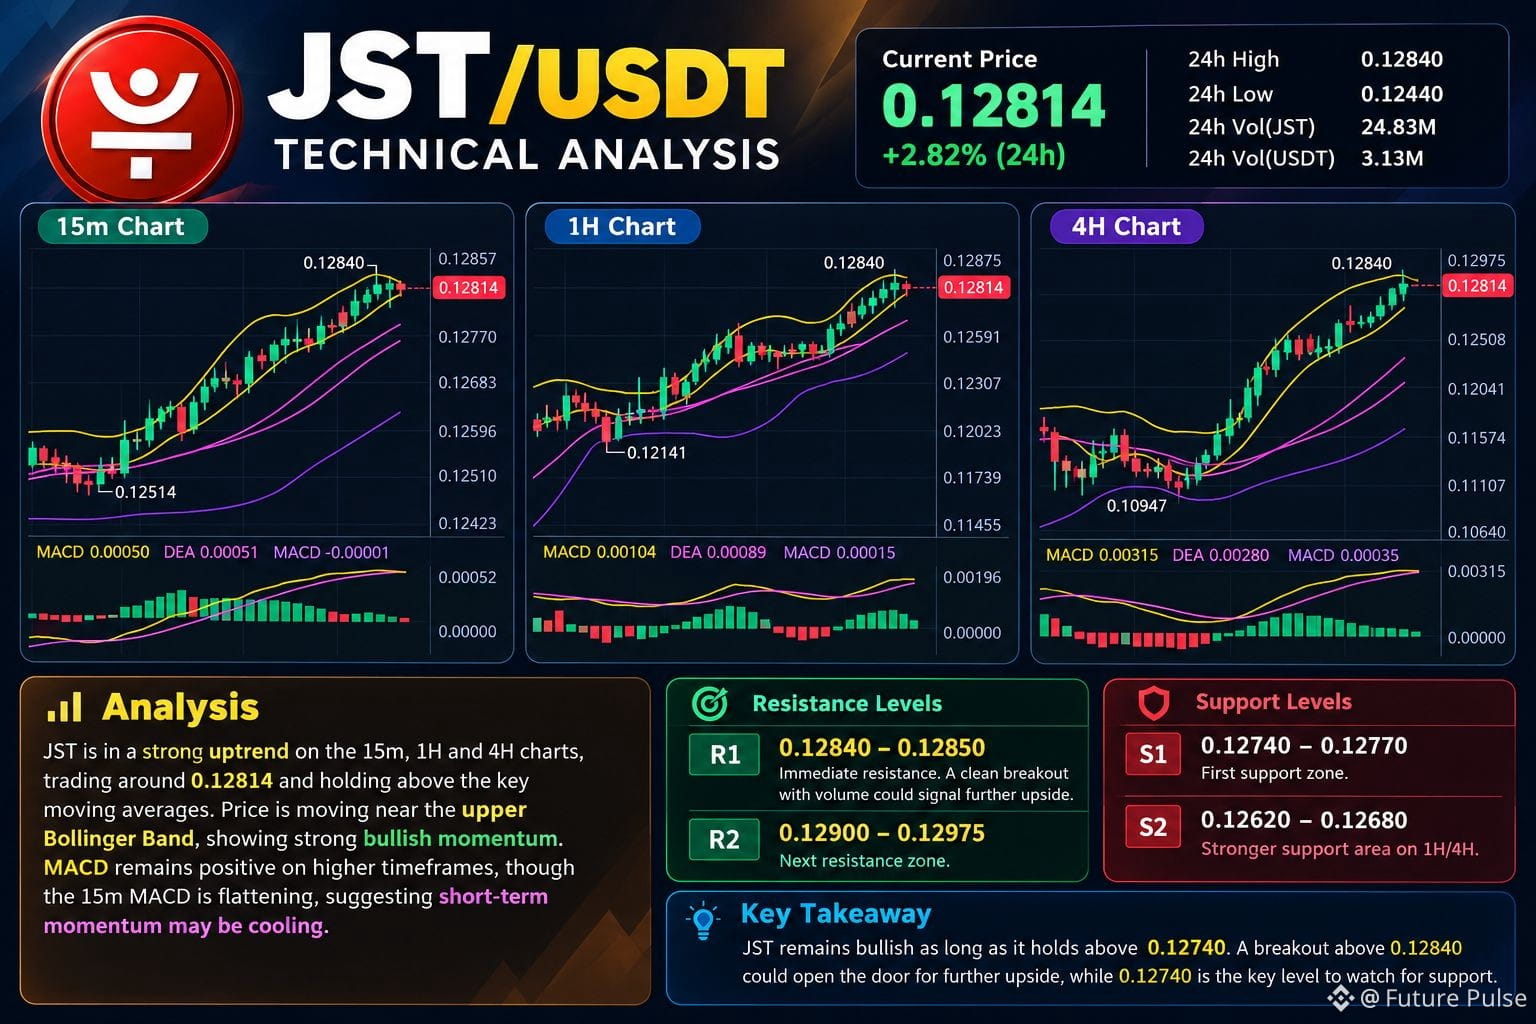
JST is showing a strong bullish structure across the 15m, 1H and 4H charts. Price is around 0.12814, holding above the key moving averages while the 1H and 4H candles remain near the upper Bollinger Band.
The immediate resistance is 0.12840–0.12850. A clean breakout with volume could signal further continuation. On the downside, 0.12740–0.12770 is the first support zone, while 0.12620–0.12680 is a stronger 1H/4H support area. MACD remains positive on higher timeframes, but the 15m MACD is flattening, suggesting short-term momentum may be cooling. 0.12840 is the key level to watch.
$MU
$NVDA
$JST
The immediate resistance is 0.12840–0.12850. A clean breakout with volume could signal further continuation. On the downside, 0.12740–0.12770 is the first support zone, while 0.12620–0.12680 is a stronger 1H/4H support area. MACD remains positive on higher timeframes, but the 15m MACD is flattening, suggesting short-term momentum may be cooling. 0.12840 is the key level to watch.
$MU
$NVDA
$JST