Dash (DASH) and Hyperliquid (HYPE) Technical Update: Retracement to Support Levels
Technical chart data for Dash (DASH) and Hyperliquid (HYPE) highlights short-term corrective price action following recent local peaks. Both assets are testing key support zones as market participants monitor potential bounce levels. Here is the technical setup for both pairs.
Dash (DASH/USDT) Analysis: Pullback Testing MA(25) Support
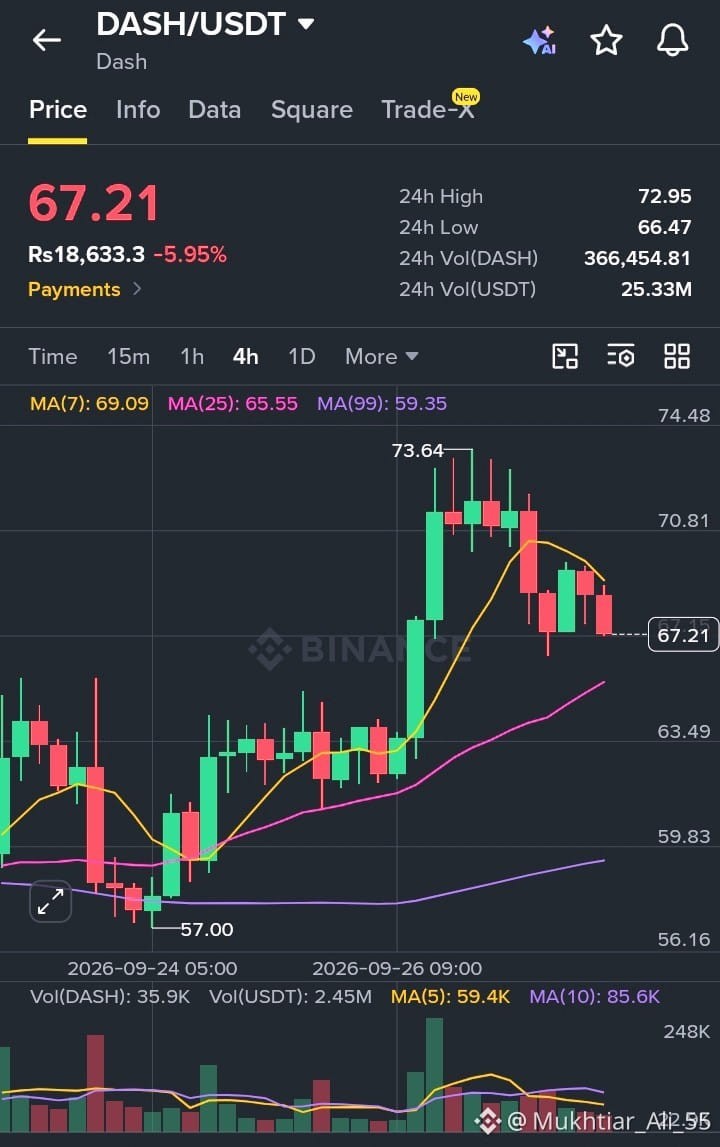
Current Price: 67.21 (-5.95%)
24h High / Low: 72.95 / 66.47
24h Volume (DASH): 366,454.81
24h Volume (USDT): 25.33M
Technical Analysis:
After rallying from its 57.00 swing low to a peak of 73.64, DASH experienced a correction, dropping below the MA(7) at 69.09. Price action is currently consolidating just above the intermediate MA(25) support level at 65.55. The overall baseline remains supported by the long-term MA(99) at 59.35. Holding above the 65.50–66.00 region is critical for buyers to regain momentum toward 70.00, while losing 65.55 risks extended retesting toward 63.50.
Hyperliquid (HYPE/USDT) Analysis: Range Testing Key Demand Zone
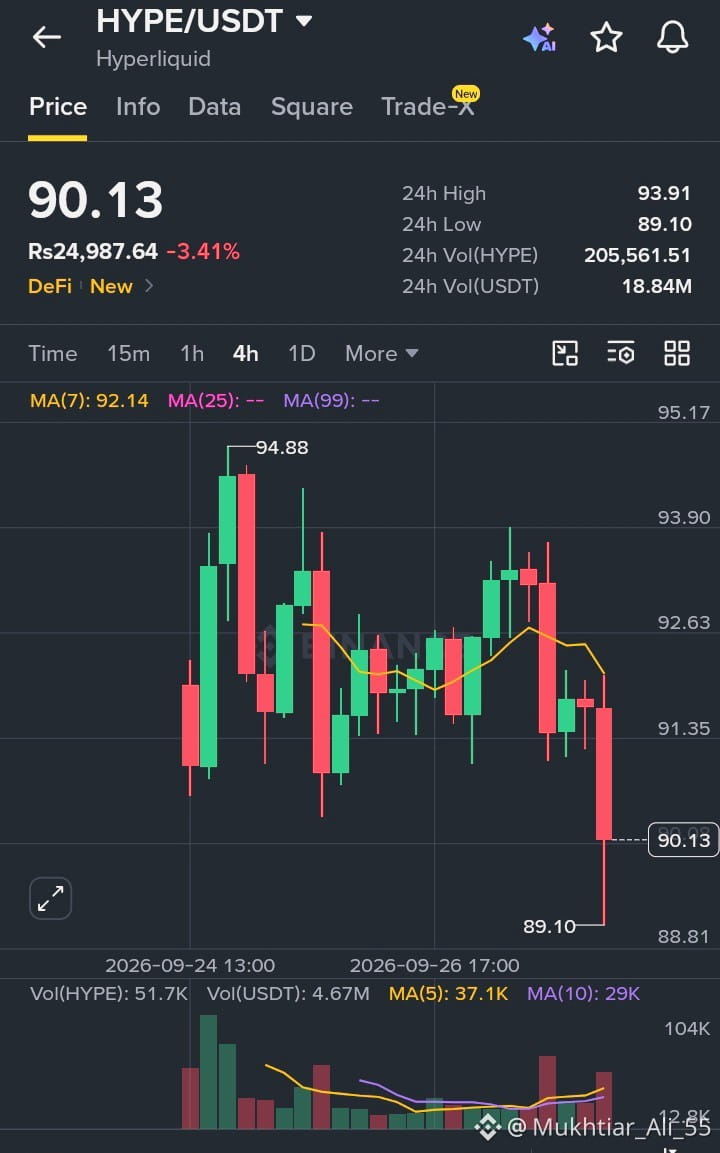
Current Price: 90.13 (-3.41%)
24h High / Low: 93.91 / 89.10
24h Volume (HYPE): 205,561.51
24h Volume (USDT): 18.84M
Technical Analysis:
HYPE remains bounded within a wide consolidation range following its peak at 94.88. Recent selling pressure pushed price action below the MA(7) at 92.14, taking the asset toward its immediate 24h low support at 89.10. Reclaiming 92.15 is essential for bulls to signal a recovery toward 93.90, while a breakdown below 89.10 could open room for a deeper move lower.
Market Outlook
Both DASH and HYPE are undergoing technical pullbacks within established ranges. Key support levels—65.55 for DASH and 89.10 for HYPE—will determine whether buyers step in to trigger a rebound.
#DASH #HYPE #CryptoAnalysis #TechnicalAnalysis #Altcoins
$DASH
$HYPE
Technical chart data for Dash (DASH) and Hyperliquid (HYPE) highlights short-term corrective price action following recent local peaks. Both assets are testing key support zones as market participants monitor potential bounce levels. Here is the technical setup for both pairs.
Dash (DASH/USDT) Analysis: Pullback Testing MA(25) Support
Current Price: 67.21 (-5.95%)
24h High / Low: 72.95 / 66.47
24h Volume (DASH): 366,454.81
24h Volume (USDT): 25.33M
Technical Analysis:
After rallying from its 57.00 swing low to a peak of 73.64, DASH experienced a correction, dropping below the MA(7) at 69.09. Price action is currently consolidating just above the intermediate MA(25) support level at 65.55. The overall baseline remains supported by the long-term MA(99) at 59.35. Holding above the 65.50–66.00 region is critical for buyers to regain momentum toward 70.00, while losing 65.55 risks extended retesting toward 63.50.
Hyperliquid (HYPE/USDT) Analysis: Range Testing Key Demand Zone
Current Price: 90.13 (-3.41%)
24h High / Low: 93.91 / 89.10
24h Volume (HYPE): 205,561.51
24h Volume (USDT): 18.84M
Technical Analysis:
HYPE remains bounded within a wide consolidation range following its peak at 94.88. Recent selling pressure pushed price action below the MA(7) at 92.14, taking the asset toward its immediate 24h low support at 89.10. Reclaiming 92.15 is essential for bulls to signal a recovery toward 93.90, while a breakdown below 89.10 could open room for a deeper move lower.
Market Outlook
Both DASH and HYPE are undergoing technical pullbacks within established ranges. Key support levels—65.55 for DASH and 89.10 for HYPE—will determine whether buyers step in to trigger a rebound.
#DASH #HYPE #CryptoAnalysis #TechnicalAnalysis #Altcoins
$DASH
$HYPE