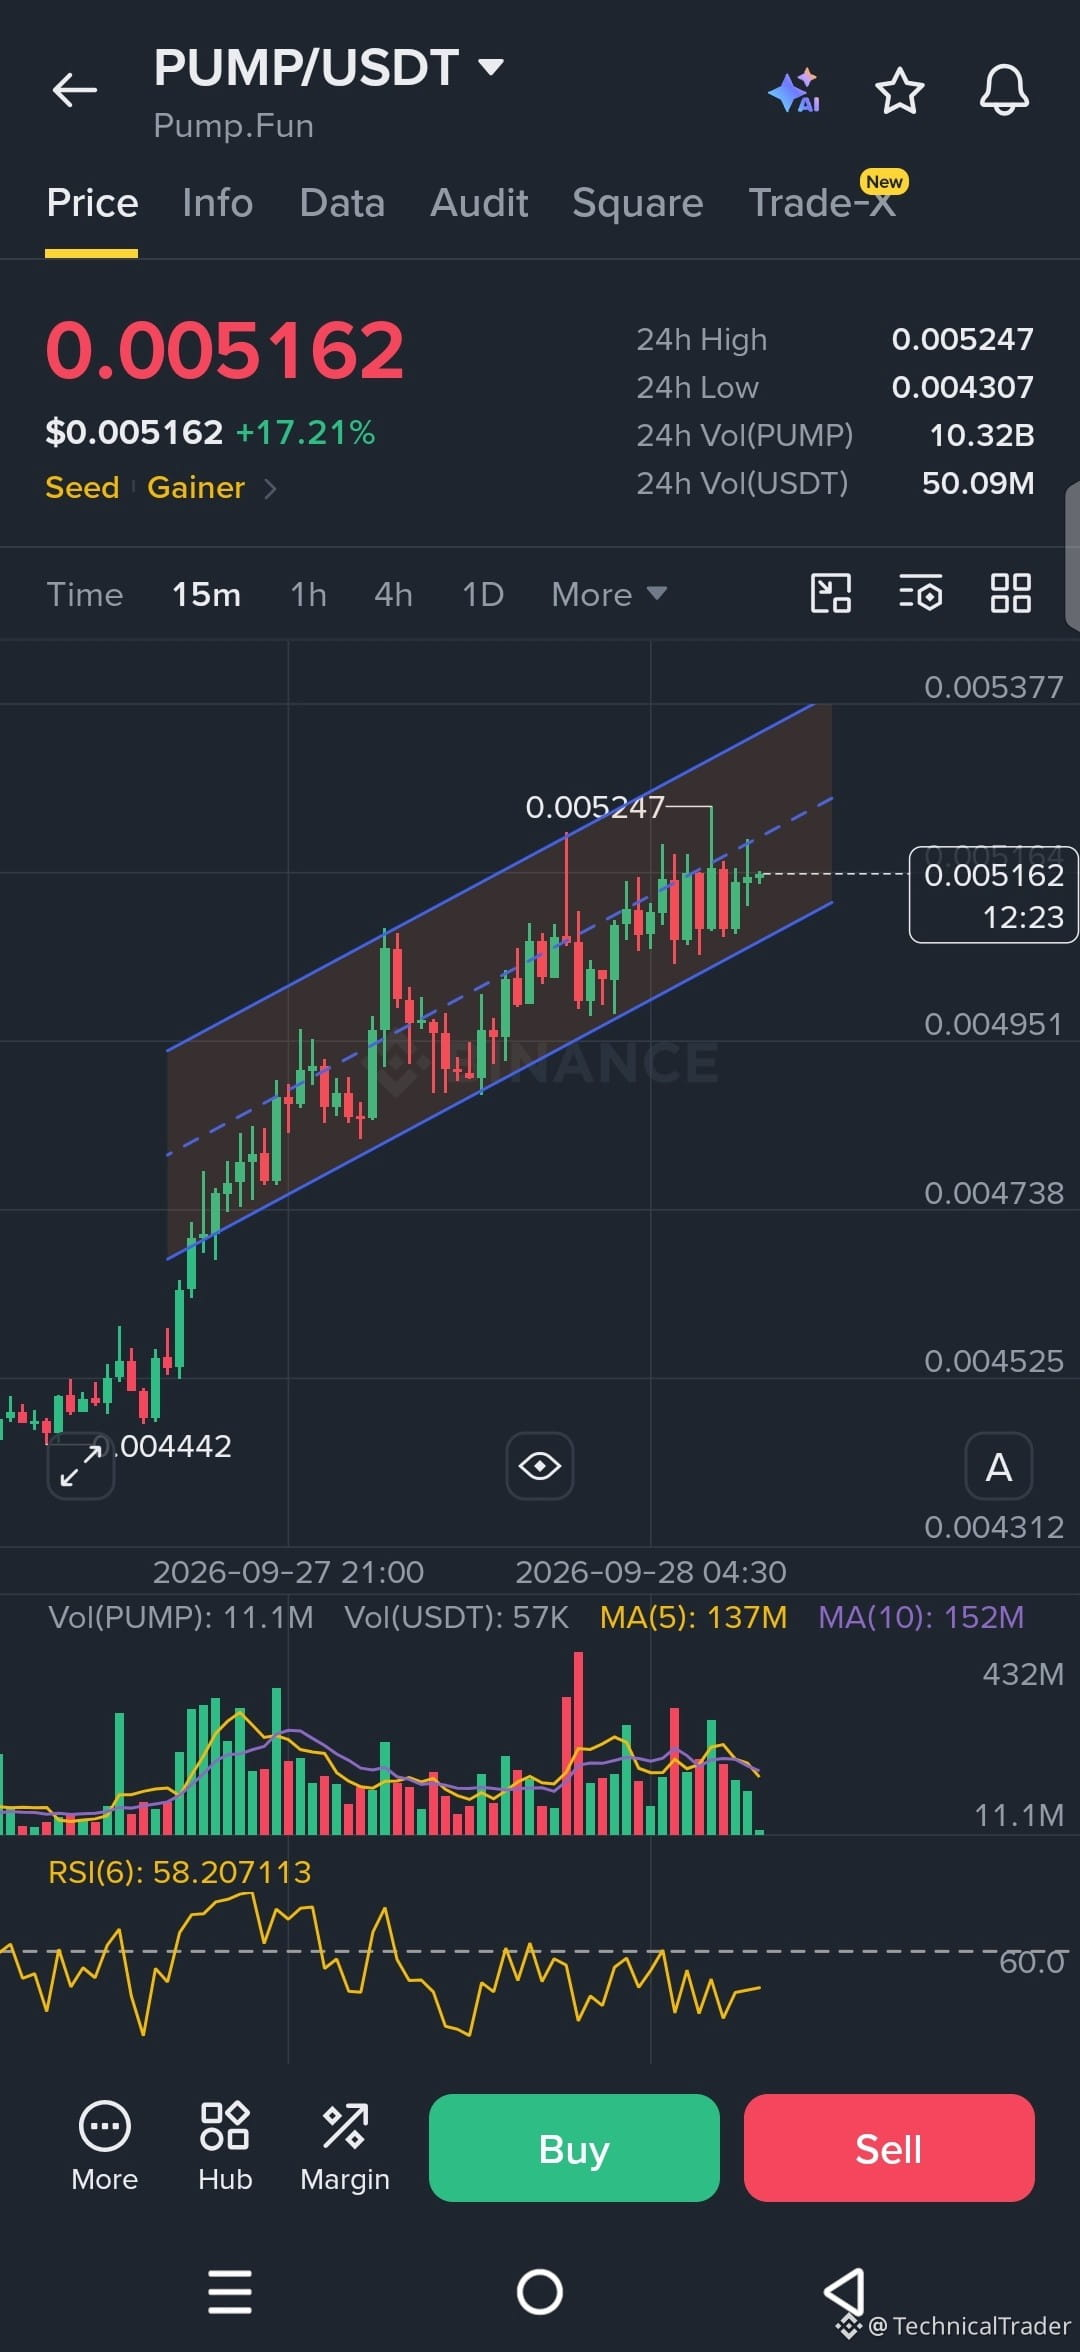
$PUMP is currently around 0.005162, up 17.21%, and the 15m chart is clearly moving inside an ascending channel. You can see a sequence of higher highs and higher lows, with price respecting the channel boundaries so far. 📈
Take a look at the 0.005247 area 👀 This is the recent visible high and immediate resistance. Price has tested this zone and pulled back slightly, so a clean break and hold above 0.005247 could open the way toward the upper channel area around 0.00537. On the other side, the middle and lower channel lines are important areas to watch for support.
RSI is around 58, which shows momentum is still positive without being extremely overextended. Volume has also been active during the move, but notice the recent candles are becoming more mixed near resistance. If price loses the lower channel support and starts forming lower highs and lower lows, the current structure would weaken and a deeper pullback could develop. 📉
For the bullish scenario, watch how price reacts around 0.005247 and whether it can hold above that level. For the bearish scenario, a clear breakdown of the lower channel would invalidate the current rising structure. Keep an eye on these reactions rather than assuming either direction is guaranteed. 🎯
Guys follow for more chart analysis 😎 I’ll keep showing you exactly what the chart is telling us. 👀🔥
Take a look at the 0.005247 area 👀 This is the recent visible high and immediate resistance. Price has tested this zone and pulled back slightly, so a clean break and hold above 0.005247 could open the way toward the upper channel area around 0.00537. On the other side, the middle and lower channel lines are important areas to watch for support.
RSI is around 58, which shows momentum is still positive without being extremely overextended. Volume has also been active during the move, but notice the recent candles are becoming more mixed near resistance. If price loses the lower channel support and starts forming lower highs and lower lows, the current structure would weaken and a deeper pullback could develop. 📉
For the bullish scenario, watch how price reacts around 0.005247 and whether it can hold above that level. For the bearish scenario, a clear breakdown of the lower channel would invalidate the current rising structure. Keep an eye on these reactions rather than assuming either direction is guaranteed. 🎯
Guys follow for more chart analysis 😎 I’ll keep showing you exactly what the chart is telling us. 👀🔥