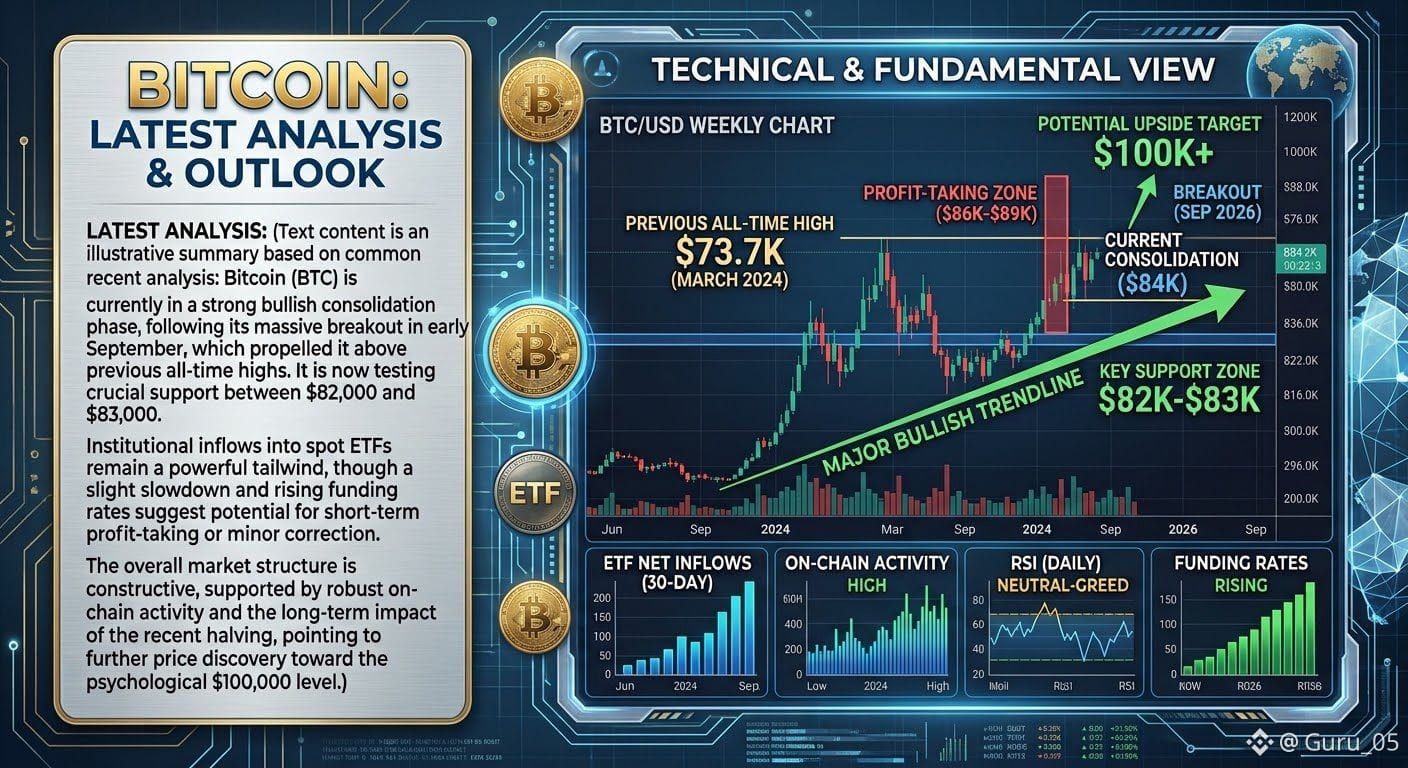
$BTC Bitcoin is currently exhibiting a strong bullish structure, characterized by a consolidation phase near historical highs around $84,000. This follows a powerful breakout earlier in September, confirming that the long-term trend remains upward.
Key Support and Resistance Levels:
A "Major Bullish Trendline" has been established throughout 2024 and 2026, providing the foundation for the current ascent. The chart identifies a critical support zone between $82,000 and $83,000, which must hold for the bullish momentum to continue. On the upside, immediate resistance is noted in the $86,000 to $89,000 zone, which is marked as a potential profit-taking area. A clean break above this resistance could clear the path toward the psychological target of $100,000+.
Fundamental Data Inflows and Indicators:
The fundamental picture strongly supports the technical breakout. Spot ETF inflows over the last 30 days show a significant upward trajectory, indicating sustained institutional demand. Simultaneously, on-chain activity is rated as "High," reflecting robust network utilization. While the daily Relative Strength Index (RSI) is in "Neutral-Greed" territory, suggesting the market is not yet critically overbought, rising funding rates indicate increasing leveraged long interest. This combination supports the view that further price discovery is likely, though a minor, healthy correction should be expected if funding rates become too elevated in the near term.
#BitwiseFilesFinalNEARSpotETFProspectus #BitgetHackerMoves$83MStolenXRP #bitcoin #Binance #StrategyStriveAdd2305BitcoinThisWeek
Key Support and Resistance Levels:
A "Major Bullish Trendline" has been established throughout 2024 and 2026, providing the foundation for the current ascent. The chart identifies a critical support zone between $82,000 and $83,000, which must hold for the bullish momentum to continue. On the upside, immediate resistance is noted in the $86,000 to $89,000 zone, which is marked as a potential profit-taking area. A clean break above this resistance could clear the path toward the psychological target of $100,000+.
Fundamental Data Inflows and Indicators:
The fundamental picture strongly supports the technical breakout. Spot ETF inflows over the last 30 days show a significant upward trajectory, indicating sustained institutional demand. Simultaneously, on-chain activity is rated as "High," reflecting robust network utilization. While the daily Relative Strength Index (RSI) is in "Neutral-Greed" territory, suggesting the market is not yet critically overbought, rising funding rates indicate increasing leveraged long interest. This combination supports the view that further price discovery is likely, though a minor, healthy correction should be expected if funding rates become too elevated in the near term.
#BitwiseFilesFinalNEARSpotETFProspectus #BitgetHackerMoves$83MStolenXRP #bitcoin #Binance #StrategyStriveAdd2305BitcoinThisWeek