

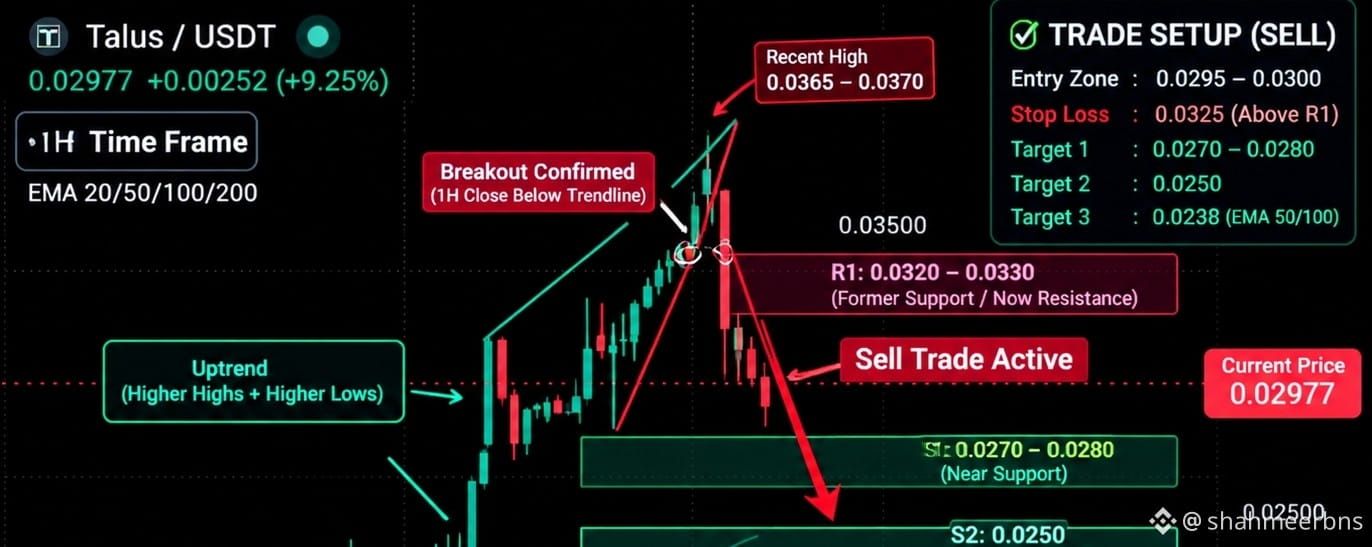

📊 TALUS/USDT — Professional Technical Analysis
Image ke chart structure ko dekh kar short-term setup mein strong rejection nazar aa rahi hai.
Current price: ~0.02977
Recent high: ~0.0365–0.0370
🔹 1. Market Structure
Pehle clear bullish uptrend tha — higher highs + higher lows.
Price ne ~0.020 se strong rally karke ~0.0365 area tak move diya.
Lekin top par strong bearish rejection aayi.
Last large red candle ne short-term bullish structure ko damage kiya hai.
🔹 2. Trendline
Chart mein rising structure ke andar price move kar raha tha, lekin latest dump ne lower rising trendline ke neeche break diya hai.
➡️ Iska matlab short-term mein bullish momentum weak hua hai.
➡️ Lekin sirf trendline break ko complete reversal nahi maana ja sakta jab tak important support bhi break na ho.
🔹 3. Important Levels
Level Role
0.0365–0.0370 Major resistance / recent high
0.0320–0.0330 First recovery resistance
0.0295–0.0300 Current decision zone
0.0270–0.0280 Important short-term support
0.0250 Major support
0.02380 EMA support
0.02095 Stronger EMA support
🔥 EMA Structure
Chart mein price abhi bhi major EMA levels ke upar hai:
EMA around 0.02380
EMA around 0.02095
Isliye bigger-picture trend abhi completely bearish confirm nahi hua.
Lekin price ka itni aggressively EMA se door chale jana aur phir sharp rejection lena overextension + profit-taking ka signal ho sakta hai.
📈 Bullish Scenario
Agar price:
0.027–0.030 zone hold kare
→ consolidation ho
→ phir 0.032–0.033 reclaim kare
→ aur volume ke saath 0.0365 break kare
to bullish structure dobara strengthen ho sakta hai.
0.0365–0.0370 ke upar confirmed breakout + candle close aaye to next upside continuation ka setup develop ho sakta hai.
📉 Bearish Scenario
Agar 0.027 area decisively break hota hai aur price uske neeche sustain karta hai:
0.027 → 0.025 → 0.0238
tak deeper retracement possible ho sakta hai.
Agar 0.0238 bhi lose ho jaye, to chart ka medium-term bullish structure considerably weaker ho jayega.
⚠️ Sabse Important Point
Abhi immediately green candle dekh kar long lena risky hai. Sharp rejection ke baad better confirmation ye hogi ke price pehle support establish kare aur phir broken trendline/resistance ko reclaim kare.
Current structure:
🟢 Bigger trend: Bullish
🟠 Short-term momentum: Bearish/Correction
🔴 Immediate resistance: 0.032–0.033
🟢 Key support: 0.027–0.028
🟢 Major EMA support: 0.0238
Overall: Chart abhi bullish trend ke andar strong short-term correction jaisa dikh raha hai; reversal ko confirm karne ke liye support breakdown ya recovery/reclaim ka wait karna zyada technically meaningful hoga.