$GLMR Guys, in this post I’ll analyze $GLMR and break down what the chart is showing us right now. 👀
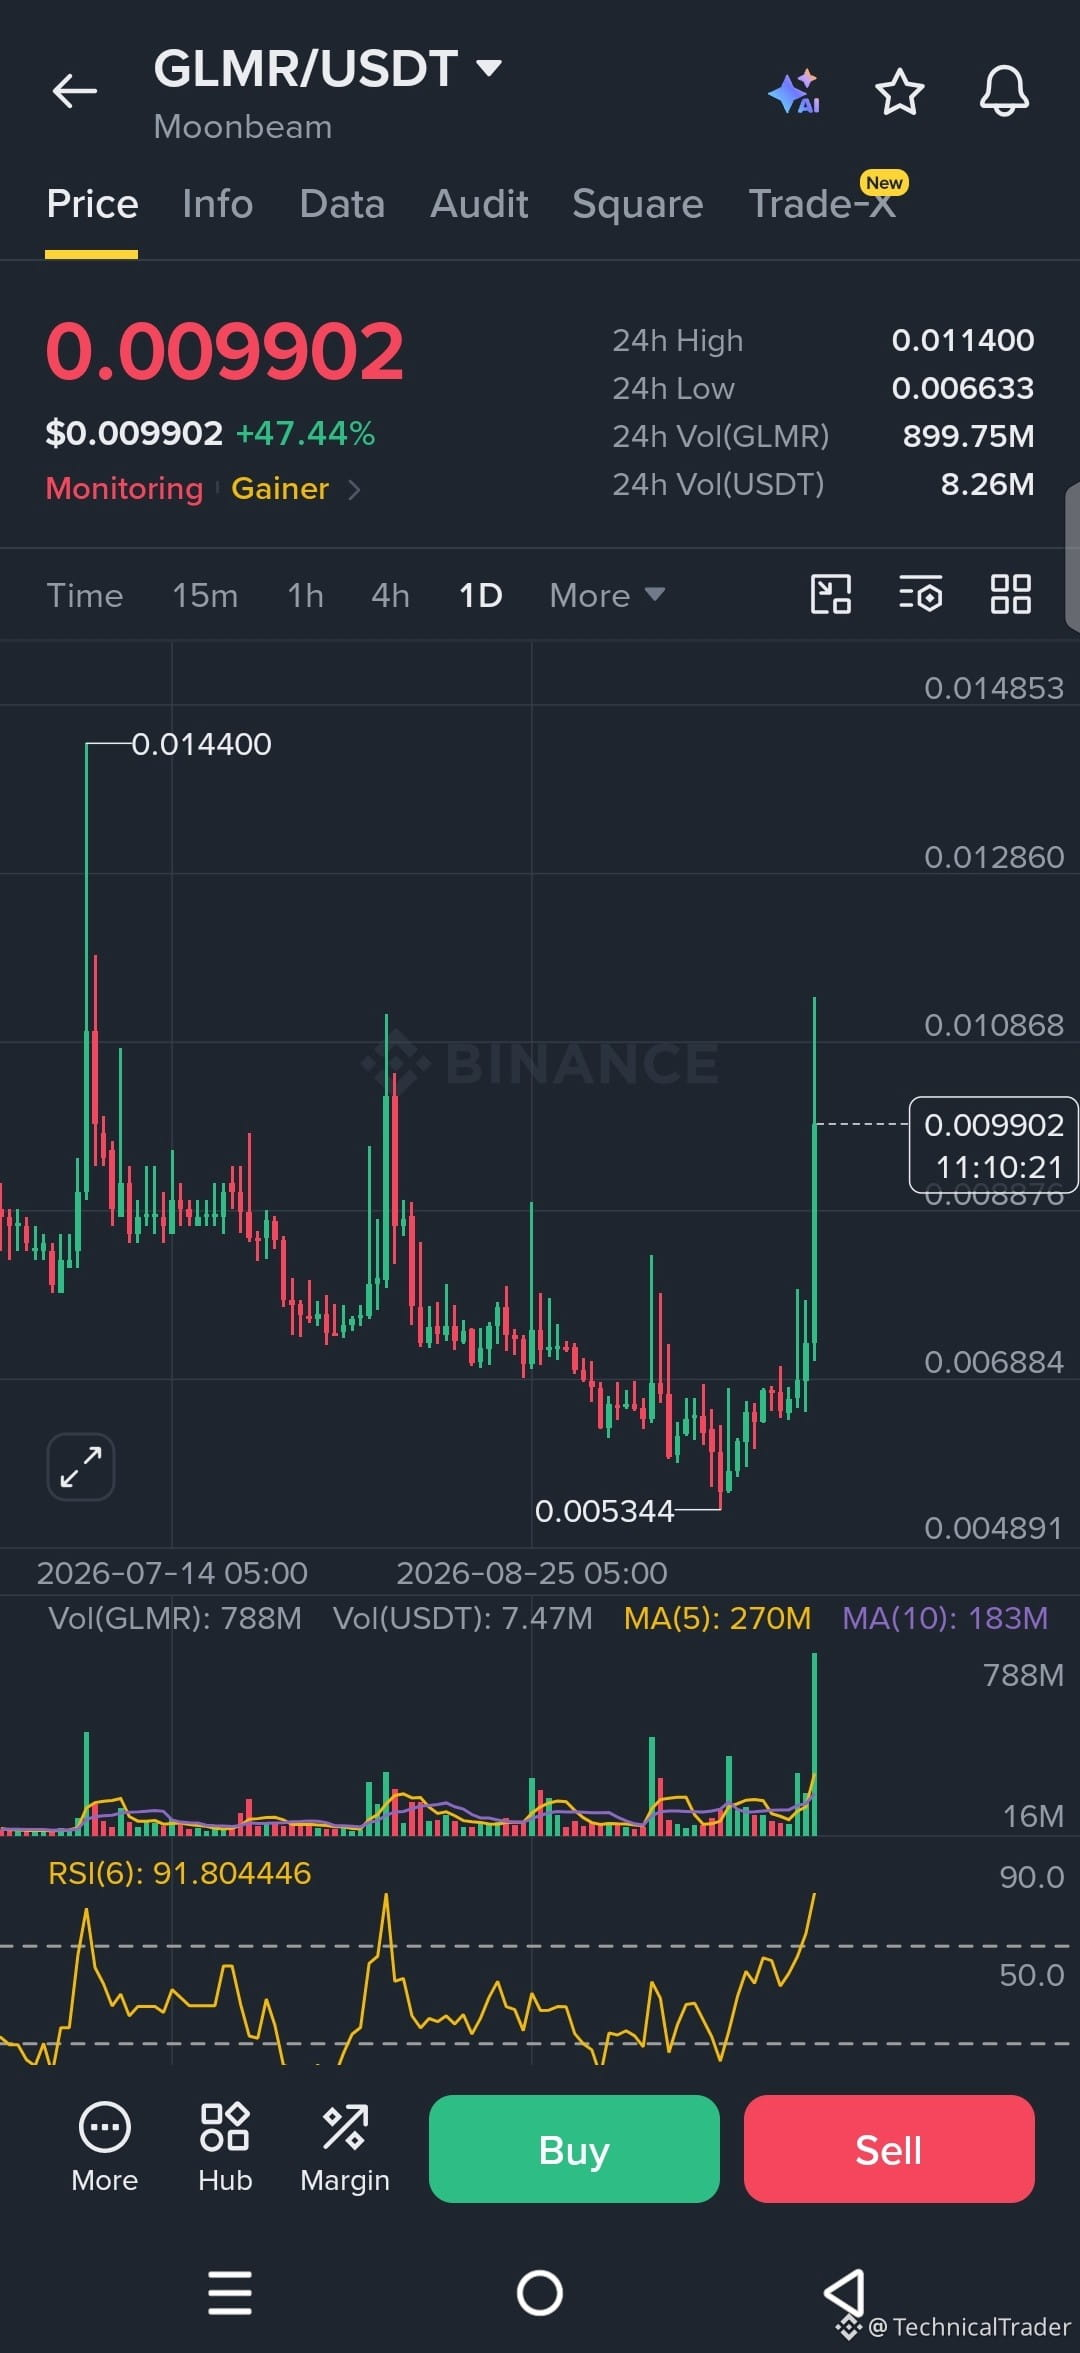
Take a look at this daily chart. Price spent a long stretch making lower highs and lower lows, sliding from that 0.014 area all the way down toward the 0.005344 low. That downtrend was clear until the recent sharp green candle exploded higher and pushed us up to 0.009902. Notice how strong that recovery move has been, with volume picking up on the upside.
You can see price is now sitting right around the middle of the recent range after that big bounce. The 24h high at 0.011400 is the nearest resistance overhead, while the low around 0.0053 remains the key support floor below. RSI(6) is printing 91.8, which shows this move has been aggressive and price is stretched in the short term.
If buyers keep defending the area above the recent low and push through 0.0114, we could see a continuation toward the higher levels from earlier in the chart. On the other side, a rejection here and a close back under the recent green candle’s open would open the door for another test of the lower support. Watch how price reacts around 0.0099–0.0114 next, because a clean break or rejection there will tell us a lot about the next leg.
Guys follow for more chart analysis 😎 I’ll keep showing you exactly what the chart is telling us. 👀🔥
Take a look at this daily chart. Price spent a long stretch making lower highs and lower lows, sliding from that 0.014 area all the way down toward the 0.005344 low. That downtrend was clear until the recent sharp green candle exploded higher and pushed us up to 0.009902. Notice how strong that recovery move has been, with volume picking up on the upside.
You can see price is now sitting right around the middle of the recent range after that big bounce. The 24h high at 0.011400 is the nearest resistance overhead, while the low around 0.0053 remains the key support floor below. RSI(6) is printing 91.8, which shows this move has been aggressive and price is stretched in the short term.
If buyers keep defending the area above the recent low and push through 0.0114, we could see a continuation toward the higher levels from earlier in the chart. On the other side, a rejection here and a close back under the recent green candle’s open would open the door for another test of the lower support. Watch how price reacts around 0.0099–0.0114 next, because a clean break or rejection there will tell us a lot about the next leg.
Guys follow for more chart analysis 😎 I’ll keep showing you exactly what the chart is telling us. 👀🔥