SOLANA $SOL IS KNOCKING ON A LEVEL THAT COULD DECIDE THE NEXT MOVE.
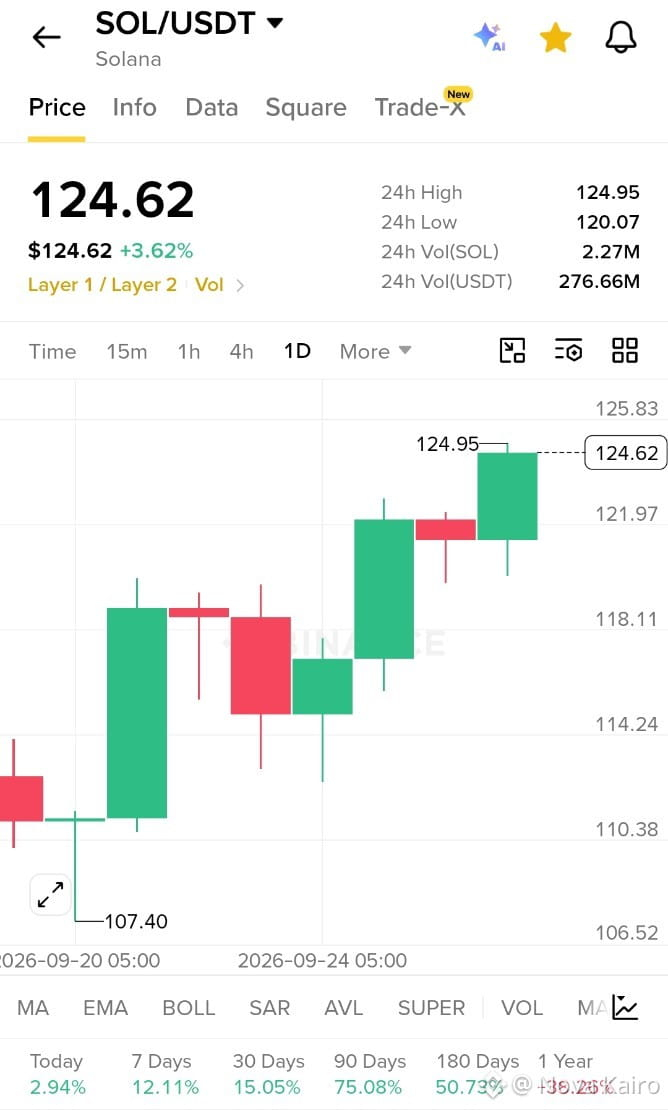
SOL is trading around $124.62, up 3.62%, with price pushing close to the $124.95 daily high.
The 1D chart is getting interesting:
• $120–$122 → key short-term support zone
• $124.95–$125 → immediate resistance
• A clean daily break above $125 could put the next psychological levels into focus.
• Recent momentum remains strong, with the chart showing a clear recovery from the $107.40 low.
But here’s the real setup:
SOL has already climbed roughly 15% in 30 days and more than 75% in 90 days. At this point, chasing the green candle is easy. The harder question is whether buyers can actually turn $125 resistance into confirmed support.
If $125 breaks and holds, the structure changes.
If it gets rejected again, this could become another liquidity trap near the highs.
The chart is no longer asking whether SOL can rally.
It is asking whether buyers can defend the breakout after $125.
SOLANA — breakout, rejection, or one more shakeout before the real move?
SOL is trading around $124.62, up 3.62%, with price pushing close to the $124.95 daily high.
The 1D chart is getting interesting:
• $120–$122 → key short-term support zone
• $124.95–$125 → immediate resistance
• A clean daily break above $125 could put the next psychological levels into focus.
• Recent momentum remains strong, with the chart showing a clear recovery from the $107.40 low.
But here’s the real setup:
SOL has already climbed roughly 15% in 30 days and more than 75% in 90 days. At this point, chasing the green candle is easy. The harder question is whether buyers can actually turn $125 resistance into confirmed support.
If $125 breaks and holds, the structure changes.
If it gets rejected again, this could become another liquidity trap near the highs.
The chart is no longer asking whether SOL can rally.
It is asking whether buyers can defend the breakout after $125.
SOLANA — breakout, rejection, or one more shakeout before the real move?