➡️ $AMP Is This Downtrend About to Make Its Next Big Move? 👀
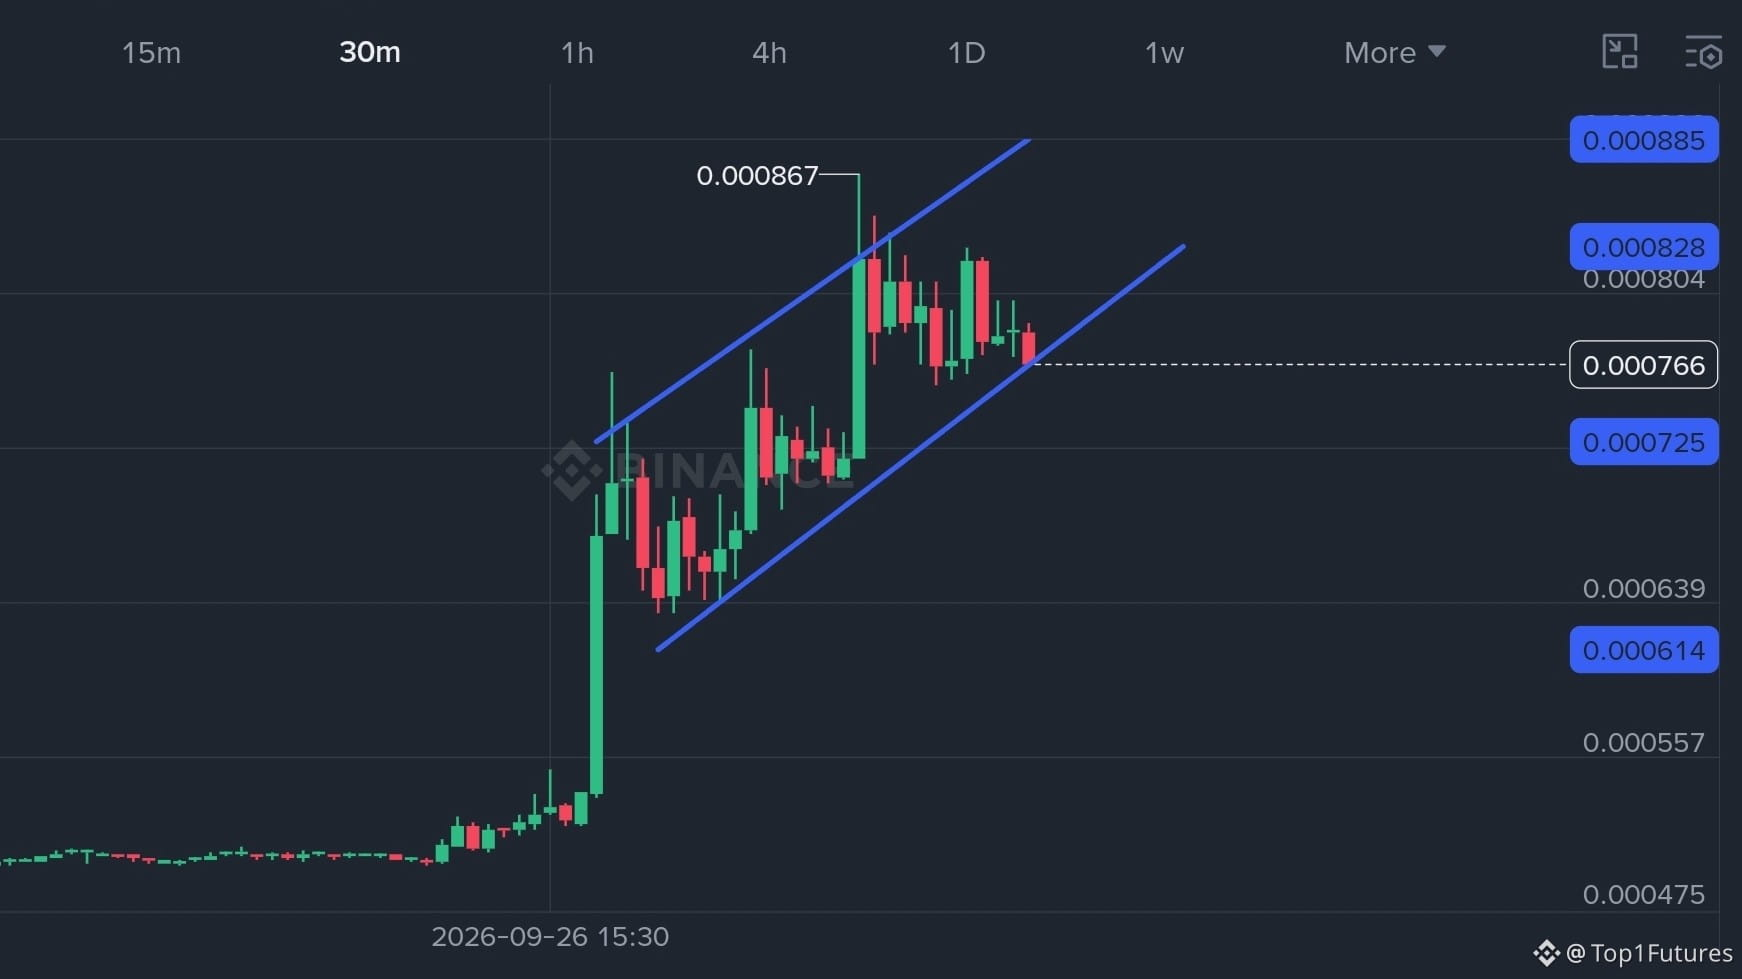
AMP is showing an interesting structure on the 30-minute chart. After a powerful breakout, price has been moving inside a clearly rising channel, creating a series of higher lows. Right now, price is around 0.000766, sitting close to the lower trendline. This is the zone traders should watch carefully.
From a classic TA perspective, 0.000725 is the first important support. If buyers defend this area, a bounce toward 0.000804–0.000828 could develop. A breakout above 0.000828 may open the door toward the previous high around 0.000867, with 0.000885 as another potential upside level.
But here’s the catch 👀: if the channel breaks and 0.000725 fails, momentum could weaken and price may revisit 0.000639 or even 0.000614.
🧠 Market psychology: Buyers want to prove the pullback is only a reset—not the beginning of a reversal.
❓ Will AMP bounce from the channel support, or are sellers preparing the next drop?
I can also create an image explaining these key support and resistance levels.
#amp
AMP is showing an interesting structure on the 30-minute chart. After a powerful breakout, price has been moving inside a clearly rising channel, creating a series of higher lows. Right now, price is around 0.000766, sitting close to the lower trendline. This is the zone traders should watch carefully.
From a classic TA perspective, 0.000725 is the first important support. If buyers defend this area, a bounce toward 0.000804–0.000828 could develop. A breakout above 0.000828 may open the door toward the previous high around 0.000867, with 0.000885 as another potential upside level.
But here’s the catch 👀: if the channel breaks and 0.000725 fails, momentum could weaken and price may revisit 0.000639 or even 0.000614.
🧠 Market psychology: Buyers want to prove the pullback is only a reset—not the beginning of a reversal.
❓ Will AMP bounce from the channel support, or are sellers preparing the next drop?
I can also create an image explaining these key support and resistance levels.
#amp