$DASH Just Hit a Fresh High – Now What? 👀
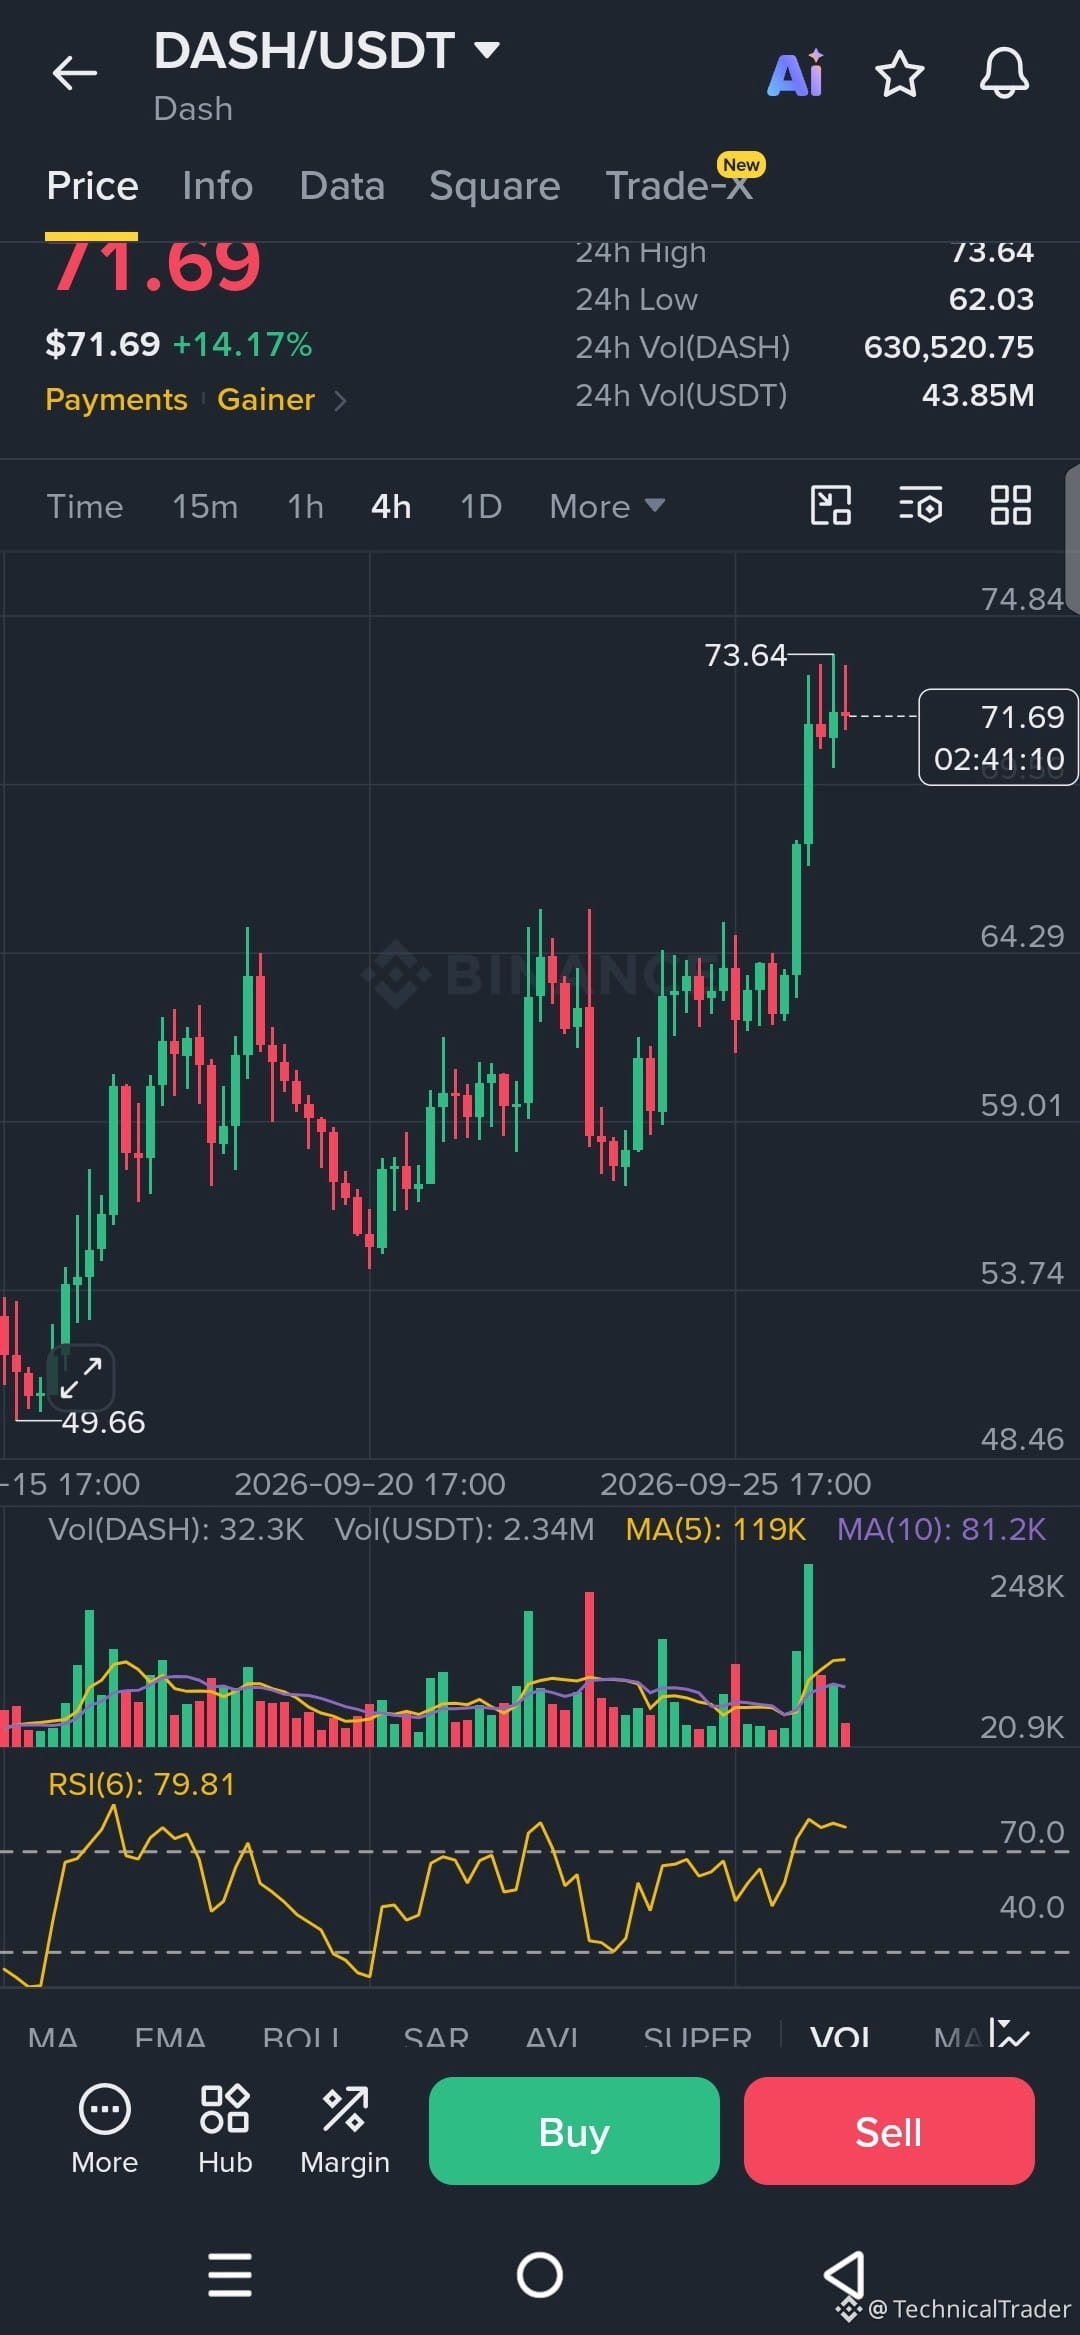
Alright guys, look at this $DASH chart on the 4H. Price just ripped up hard and tagged 73.64 before cooling off a bit to 71.69. That +14% move is no joke.
We’ve been making higher highs and higher lows for a while now. The structure is clearly up – from that low around 49-50 all the way here. The latest candles show strong buying pressure, especially that last big green move.
Right now price is sitting just under the recent high. That 73.64 level is the one I’m watching closely. We got a small rejection there, nothing crazy, but it’s the first real test of that zone.
RSI is sitting at 79.81 – that’s stretched. When it gets this high after a vertical run, we often see some breathing room or a pullback before the next leg.
Here’s what I’m watching:
If buyers step back in and we reclaim and hold above 73.64 with volume, the next leg higher opens up. That would keep the higher-high structure intact.
On the flip side, if we lose momentum and start printing lower highs from here, a pullback toward the 64-65 area becomes more likely. That’s where previous structure and the recent consolidation lived.
No forced levels – just reacting to what the chart is showing. The strong volume on the way up and the clean upward structure are still there, but that RSI is screaming “don’t chase blindly.”
Watch how price behaves around this 71.70-73.60 zone next. A clean break and hold above the high keeps the move going. A failure and drop back under recent support would change the short-term picture.
Guys follow for more chart analysis 😎 I’ll keep showing you exactly what the chart is telling us. 👀🔥
Alright guys, look at this $DASH chart on the 4H. Price just ripped up hard and tagged 73.64 before cooling off a bit to 71.69. That +14% move is no joke.
We’ve been making higher highs and higher lows for a while now. The structure is clearly up – from that low around 49-50 all the way here. The latest candles show strong buying pressure, especially that last big green move.
Right now price is sitting just under the recent high. That 73.64 level is the one I’m watching closely. We got a small rejection there, nothing crazy, but it’s the first real test of that zone.
RSI is sitting at 79.81 – that’s stretched. When it gets this high after a vertical run, we often see some breathing room or a pullback before the next leg.
Here’s what I’m watching:
If buyers step back in and we reclaim and hold above 73.64 with volume, the next leg higher opens up. That would keep the higher-high structure intact.
On the flip side, if we lose momentum and start printing lower highs from here, a pullback toward the 64-65 area becomes more likely. That’s where previous structure and the recent consolidation lived.
No forced levels – just reacting to what the chart is showing. The strong volume on the way up and the clean upward structure are still there, but that RSI is screaming “don’t chase blindly.”
Watch how price behaves around this 71.70-73.60 zone next. A clean break and hold above the high keeps the move going. A failure and drop back under recent support would change the short-term picture.
Guys follow for more chart analysis 😎 I’ll keep showing you exactly what the chart is telling us. 👀🔥