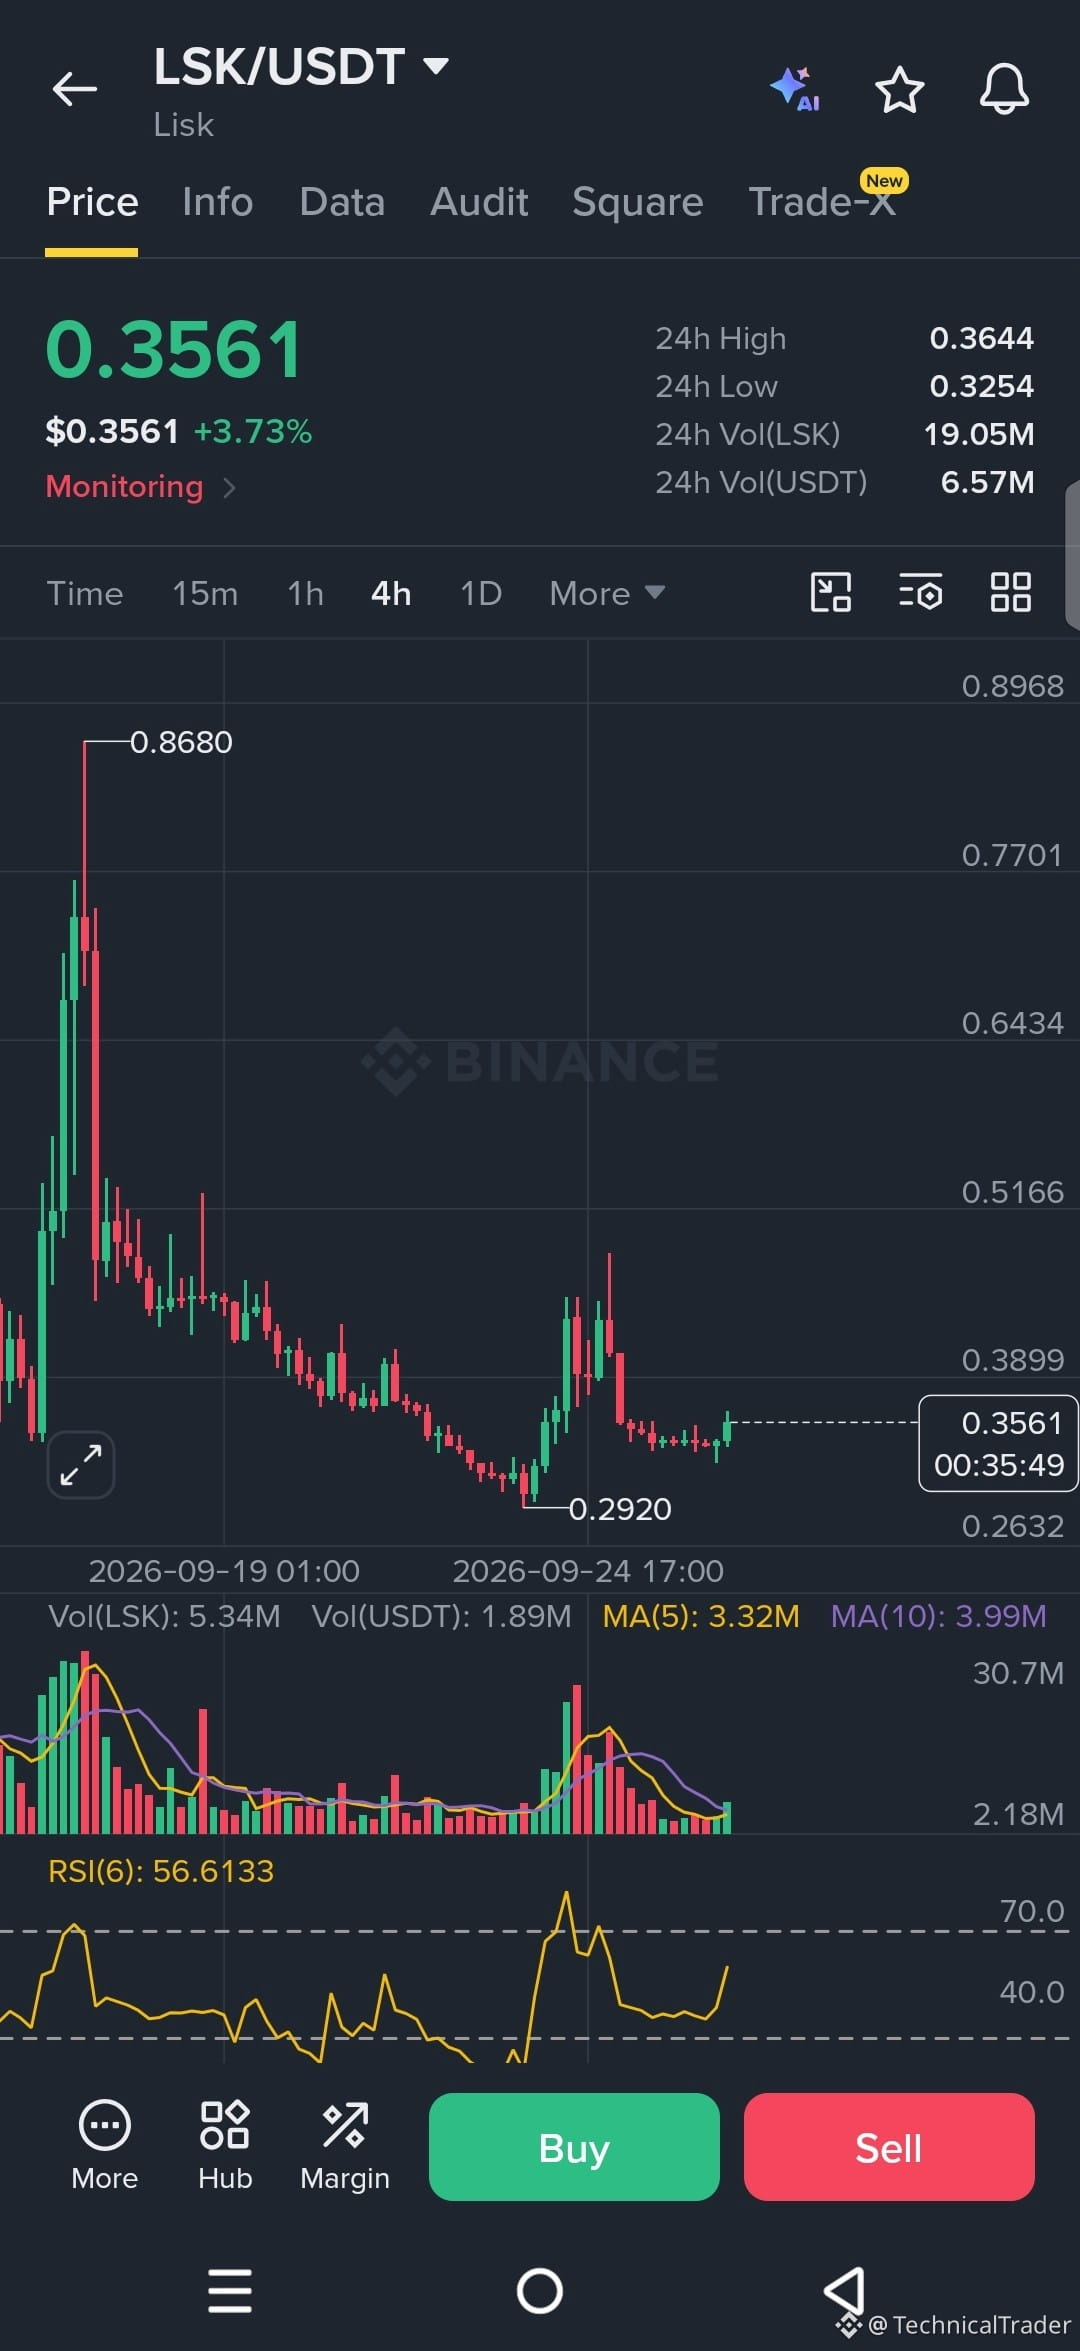
$LSK just printed a solid recovery off that 0.2920 low and we’re sitting at 0.3561 right now.
Look at this chart 👀 After that massive dump from the 0.8680 area, price kept making lower highs and lower lows until it finally found a floor around 0.2920. From there we got a sharp bounce, a quick rejection higher up, and now price is grinding higher again with small green candles.
The volume on that bounce was decent and RSI(6) is sitting at 56, so it’s not stretched either way yet. That recent low at 0.2920 is the clearest support we’ve got on the chart. On the upside, the area around 0.3899–0.40 looks like the first real resistance where sellers showed up before.
If the bulls keep pushing, a clean break and hold above 0.3899 could open the door toward the next supply zone higher up. But if we lose the current structure and slip back under 0.34–0.35, that 0.2920 low becomes the key level again. A break below it would likely bring more downside.
This is the part I’m watching closely. Price reaction right here at 0.3561 and whether we can push through that 0.3899 zone will tell us a lot in the next few candles.
Guys follow for more chart analysis 😎 I’ll keep showing you exactly what the chart is telling us. 👀🔥
Look at this chart 👀 After that massive dump from the 0.8680 area, price kept making lower highs and lower lows until it finally found a floor around 0.2920. From there we got a sharp bounce, a quick rejection higher up, and now price is grinding higher again with small green candles.
The volume on that bounce was decent and RSI(6) is sitting at 56, so it’s not stretched either way yet. That recent low at 0.2920 is the clearest support we’ve got on the chart. On the upside, the area around 0.3899–0.40 looks like the first real resistance where sellers showed up before.
If the bulls keep pushing, a clean break and hold above 0.3899 could open the door toward the next supply zone higher up. But if we lose the current structure and slip back under 0.34–0.35, that 0.2920 low becomes the key level again. A break below it would likely bring more downside.
This is the part I’m watching closely. Price reaction right here at 0.3561 and whether we can push through that 0.3899 zone will tell us a lot in the next few candles.
Guys follow for more chart analysis 😎 I’ll keep showing you exactly what the chart is telling us. 👀🔥