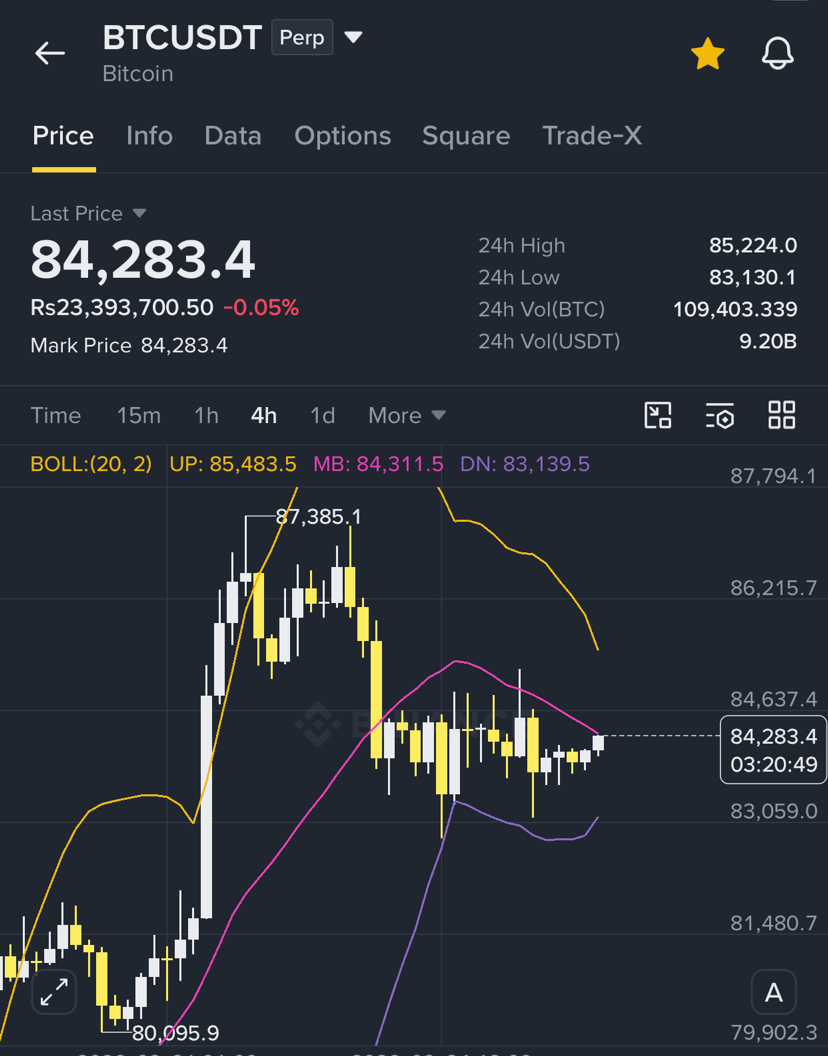
$84,270, $BTC /USDT trades near local highs after breaking above the major $82,000–$82,500 consolidation barrier. Price action currently sits within an upper execution pivot, consolidating momentum for the next macro expansion.
1. Technical Structure Overview
Trend Bias: Bullish continuation across 4H and 1D timeframes.
Market State: Higher-high expansion phase above the 20/50 EMAs. The prior macro resistance around $82,500 has now flipped into dynamic primary demand.
Current Equilibrium Pivot: $84,000 – $84,300 serves as the immediate intraday balance zone.
2. Key Price Levels
Level Type Price Zone (USDT) Structural Significance
Macro Extension Target (T2) $88,000 – $90,000 Major psychological liquidity sweep zone.
Breakout Target (T1) $86,000 – $86,600 Local swing resistance high.
Immediate Pivot $84,000 – $84,300 Mid-range consolidation pivot level.
Primary Support (Flip Zone) $82,000 – $82,500 Prior range high, now key S/R flip & 4H EMA confluence.
Major Range Support $79,800 – $80,500 Key structural invalidation level for the immediate bullish impulse.
3. Trade Setup & Scenario Planning
Scenario A: Bullish Expansion (Breakout Continuation)
Trigger: A sustained 4-hour close above $84,800 on expanding volume.
Targets: First target at $86,500, extending toward $88,500.
Invalidation / Stop Loss: Below $83,200 (protecting intraday higher low).
Scenario B: Retest & Long Entry (Dip Buy)
Trigger: A healthy pullback toward the $82,000 – $82,500 S/R flip area.
Confirmation: Look for lower-wick rejections or 1-hour bullish engulfing candle structures within this zone.
Targets: Re-test of $84,300, followed by $86,500.
Invalidation / Stop Loss: A 4-hour close below $81,200.
Scenario C: Bearish Failure / Deep Retract
Trigger: A decisive breakdown back below $80,000.
Downside Liquidity: Opens up a deeper corrective move down toward major demand at $76,000 – $76,500.
Explore execution parameters or derivative data?
1. Technical Structure Overview
Trend Bias: Bullish continuation across 4H and 1D timeframes.
Market State: Higher-high expansion phase above the 20/50 EMAs. The prior macro resistance around $82,500 has now flipped into dynamic primary demand.
Current Equilibrium Pivot: $84,000 – $84,300 serves as the immediate intraday balance zone.
2. Key Price Levels
Level Type Price Zone (USDT) Structural Significance
Macro Extension Target (T2) $88,000 – $90,000 Major psychological liquidity sweep zone.
Breakout Target (T1) $86,000 – $86,600 Local swing resistance high.
Immediate Pivot $84,000 – $84,300 Mid-range consolidation pivot level.
Primary Support (Flip Zone) $82,000 – $82,500 Prior range high, now key S/R flip & 4H EMA confluence.
Major Range Support $79,800 – $80,500 Key structural invalidation level for the immediate bullish impulse.
3. Trade Setup & Scenario Planning
Scenario A: Bullish Expansion (Breakout Continuation)
Trigger: A sustained 4-hour close above $84,800 on expanding volume.
Targets: First target at $86,500, extending toward $88,500.
Invalidation / Stop Loss: Below $83,200 (protecting intraday higher low).
Scenario B: Retest & Long Entry (Dip Buy)
Trigger: A healthy pullback toward the $82,000 – $82,500 S/R flip area.
Confirmation: Look for lower-wick rejections or 1-hour bullish engulfing candle structures within this zone.
Targets: Re-test of $84,300, followed by $86,500.
Invalidation / Stop Loss: A 4-hour close below $81,200.
Scenario C: Bearish Failure / Deep Retract
Trigger: A decisive breakdown back below $80,000.
Downside Liquidity: Opens up a deeper corrective move down toward major demand at $76,000 – $76,500.
Explore execution parameters or derivative data?