$PHA PHA/USDT — Latest Technical Analysis
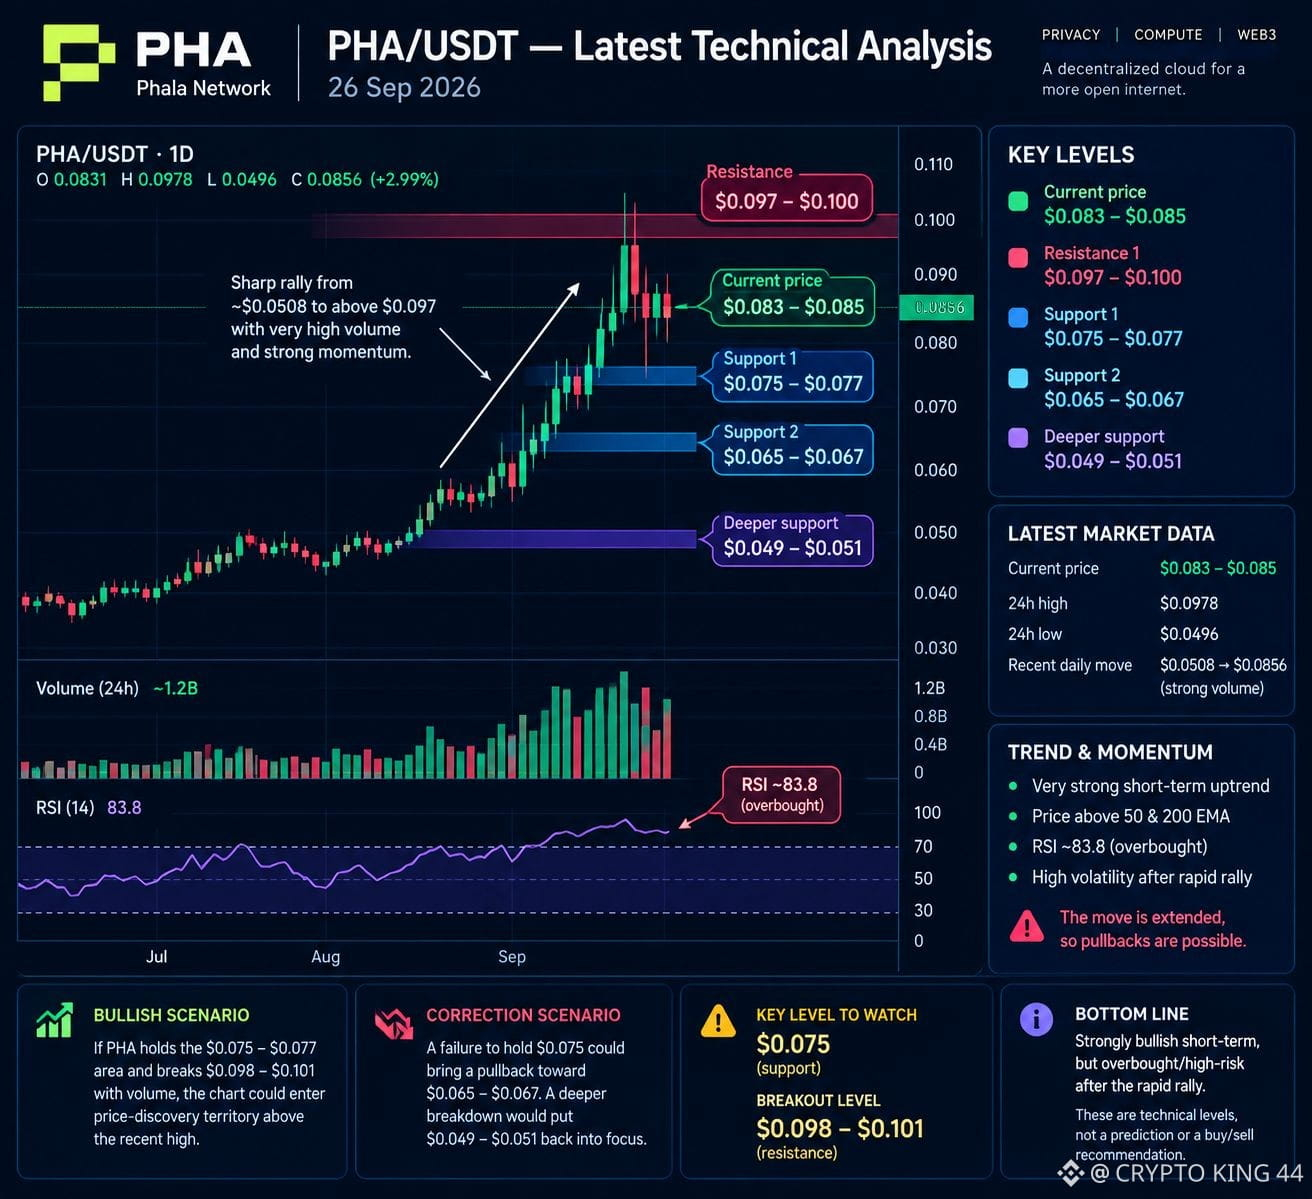
As of 26 September 2026, PHA is trading around $0.083–$0.086 USDT, after a very sharp rally. Bybit reports about $0.0831, while CoinCodex’s latest daily data shows a close around $0.0856.
📊 Key levels
LevelPHA/USDTCurrent area$0.083–0.086Resistance 1$0.097–0.101Support 1$0.075–0.077Support 2$0.065–0.067Stronger support$0.049–0.051Major lower support$0.044–0.045
PHA recently moved from roughly $0.0508 to above $0.097, with very high volume, showing exceptionally strong short-term momentum.
🔥 Momentum
The important caution is that the move is very extended. CoinLore's latest daily technical data shows RSI around 83.8, which is in overbought territory, alongside high volatility. Price is also above the 50- and 200-period EMAs.
Bullish scenario:
If PHA holds the $0.075–0.077 area and breaks $0.098–0.101 with volume, the chart could enter price-discovery territory above the recent high.
Correction scenario:
A failure to hold $0.075 could bring a pullback toward $0.065–0.067. A deeper breakdown would put $0.049–0.051 back into focus.
⚠️ Bottom line
Trend: Strongly bullish short-term, but overbought/high-risk after the rapid rally.
Key level to watch: $0.075.
Breakout level: $0.098–0.101.
Invalidation area for the current strong-momentum setup: sustained movement below roughly $0.065.
These are technical levels, not a prediction or a buy/sell recommendation. Crypto can move through these levels very quickly.
#SECCommissionerPeirceToLeaveOct2 #StrategyProposesDailyDividendsForPreferreds
As of 26 September 2026, PHA is trading around $0.083–$0.086 USDT, after a very sharp rally. Bybit reports about $0.0831, while CoinCodex’s latest daily data shows a close around $0.0856.
📊 Key levels
LevelPHA/USDTCurrent area$0.083–0.086Resistance 1$0.097–0.101Support 1$0.075–0.077Support 2$0.065–0.067Stronger support$0.049–0.051Major lower support$0.044–0.045
PHA recently moved from roughly $0.0508 to above $0.097, with very high volume, showing exceptionally strong short-term momentum.
🔥 Momentum
The important caution is that the move is very extended. CoinLore's latest daily technical data shows RSI around 83.8, which is in overbought territory, alongside high volatility. Price is also above the 50- and 200-period EMAs.
Bullish scenario:
If PHA holds the $0.075–0.077 area and breaks $0.098–0.101 with volume, the chart could enter price-discovery territory above the recent high.
Correction scenario:
A failure to hold $0.075 could bring a pullback toward $0.065–0.067. A deeper breakdown would put $0.049–0.051 back into focus.
⚠️ Bottom line
Trend: Strongly bullish short-term, but overbought/high-risk after the rapid rally.
Key level to watch: $0.075.
Breakout level: $0.098–0.101.
Invalidation area for the current strong-momentum setup: sustained movement below roughly $0.065.
These are technical levels, not a prediction or a buy/sell recommendation. Crypto can move through these levels very quickly.
#SECCommissionerPeirceToLeaveOct2 #StrategyProposesDailyDividendsForPreferreds