
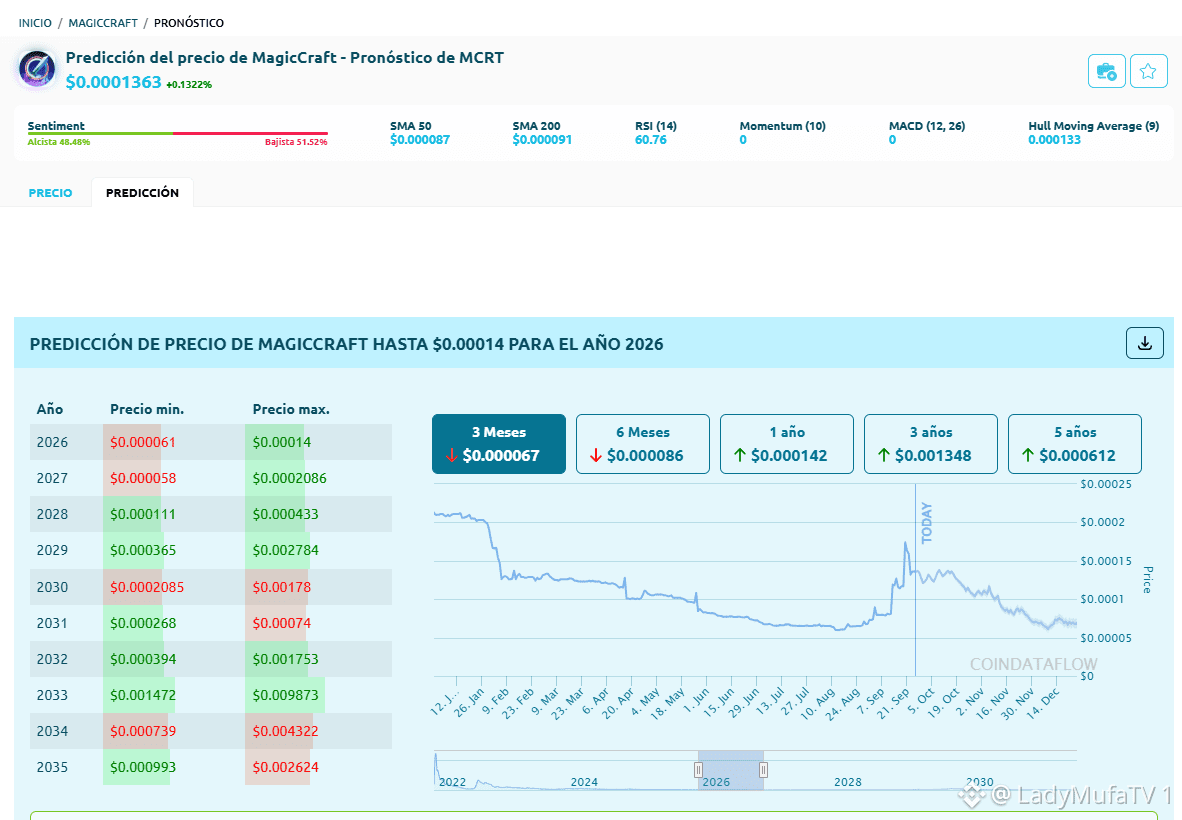
I’ve been looking more closely at $MCRT and this is actually a pretty interesting chart to learn from. MCRT was trading around $0.00008 earlier this month before seeing a major expansion in price and volume, briefly pushing above $0.00020. Now it’s pulled back considerably from that move. What I’m watching now is the bigger trend. The latest technical data I found had $MCRT still trading above its 21, 50, 100 and 200-day moving averages, with the 200-day SMA around $0.000091. RSI was around 60, so not in overbought territory according to that reading. Short-term momentum cooling down after such a big move doesn’t surprise me. What I want to understand is whether this turns into consolidation above the longer-term averages or whether the move starts losing structure. Still learning TA, so charts like this are actually useful for me: big breakout → volume expansion → pullback → now watch whether support develops. Definitely a high-risk microcap, though. That part matters just as much as the chart. $MCRT #MagicCraft #Crypto #Web3Gaming #Trading


Veröffentlichen
Haftungsausschluss: Enthält Meinungen von Drittanbietern. Keine Beratung. Binance AI wird ohne Gewähr bereitgestellt. Siehe AGB.