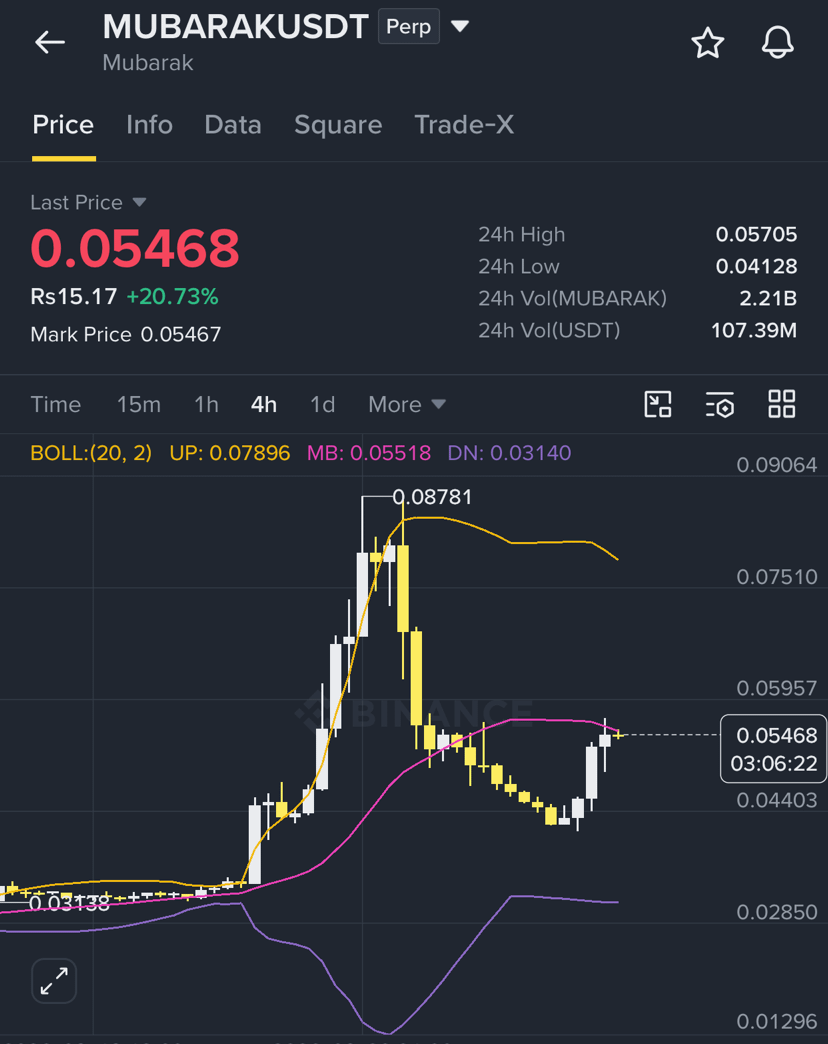
$MUBARAK USDT technical analysis — 1D chart
Current price: 0.05521 USDT
Your 0.054 reference: price is currently about 2.2% above it.
Today: opened at 0.04452, reached 0.05696, and has traded as low as 0.04154. The daily move is +23.96% versus the previous close.
Trend
MA(7): 0.04866, MA(25): 0.03486, MA(99): 0.01944
Price is above all three averages, with a bullish MA alignment.
SuperTrend: UP, with its current reference at 0.04112.
MACD: bullish; the latest golden cross occurred 4 daily candles ago. Histogram remains positive, though it is slightly below the prior bar, suggesting momentum is still positive but no longer accelerating.
Momentum and volume
RSI(6): 59.71 — neutral, rising from 51.51; it is not currently flagged as overbought.
Latest volume is 514.7M MUBARAK, about 1.03× the 7-day average, so today’s move has roughly average recent participation.
Large-order flow over 1 day is a slight net outflow of 1.19M MUBARAK (-0.49%), which is modest but does not fully confirm the price rise.
Volatility / structure
7-day range: 0.03106–0.08755. Current price remains 36.94% below that range high, reflecting very high recent volatility.
Change windows: +24.01% (1D), +76.50% (7D), +180.82% (30D). Rapid gains raise both continuation potential and pullback risk.
Current price: 0.05521 USDT
Your 0.054 reference: price is currently about 2.2% above it.
Today: opened at 0.04452, reached 0.05696, and has traded as low as 0.04154. The daily move is +23.96% versus the previous close.
Trend
MA(7): 0.04866, MA(25): 0.03486, MA(99): 0.01944
Price is above all three averages, with a bullish MA alignment.
SuperTrend: UP, with its current reference at 0.04112.
MACD: bullish; the latest golden cross occurred 4 daily candles ago. Histogram remains positive, though it is slightly below the prior bar, suggesting momentum is still positive but no longer accelerating.
Momentum and volume
RSI(6): 59.71 — neutral, rising from 51.51; it is not currently flagged as overbought.
Latest volume is 514.7M MUBARAK, about 1.03× the 7-day average, so today’s move has roughly average recent participation.
Large-order flow over 1 day is a slight net outflow of 1.19M MUBARAK (-0.49%), which is modest but does not fully confirm the price rise.
Volatility / structure
7-day range: 0.03106–0.08755. Current price remains 36.94% below that range high, reflecting very high recent volatility.
Change windows: +24.01% (1D), +76.50% (7D), +180.82% (30D). Rapid gains raise both continuation potential and pullback risk.