

Jack_TheAnalyst
6 Beiträge

Jack_TheAnalyst
Melden
Nutzer blockieren
4 Following
4 Follower
8 Like gegeben
Beiträge
PINNED
·
--
Bullisch
Hallo Binance Square!
Jack_TheAnalyst ist da
Als professioneller Content Creator, der sich darauf konzentriert, klare, unvoreingenommene Marktinformationen zu liefern.
Ich bin hier, um eine Community kluger, analytischer Trader und Investoren aufzubauen.
Tippe auf die Schaltfläche „Folgen“, um immer auf dem neuesten Stand zu bleiben: mit täglichem Marktkommentar, strukturierten Charts und Echtzeit-Analysen.
$NVDAB $AAPLB $LSK
{future}(LSKUSDT)
#BinanceWillListHyperliquid(HYPE) #FedOctoberRateHikeOddsRiseTo69.7%
Hallo Binance Square!
Jack_TheAnalyst ist da
Als professioneller Content Creator, der sich darauf konzentriert, klare, unvoreingenommene Marktinformationen zu liefern.
Ich bin hier, um eine Community kluger, analytischer Trader und Investoren aufzubauen.
Tippe auf die Schaltfläche „Folgen“, um immer auf dem neuesten Stand zu bleiben: mit täglichem Marktkommentar, strukturierten Charts und Echtzeit-Analysen.
$NVDAB $AAPLB $LSK
#BinanceWillListHyperliquid(HYPE) #FedOctoberRateHikeOddsRiseTo69.7%
Jack_TheAnalyst ist da
Als professioneller Content Creator, der sich darauf konzentriert, klare, unvoreingenommene Marktinformationen zu liefern.
Ich bin hier, um eine Community kluger, analytischer Trader und Investoren aufzubauen.
Tippe auf die Schaltfläche „Folgen“, um immer auf dem neuesten Stand zu bleiben: mit täglichem Marktkommentar, strukturierten Charts und Echtzeit-Analysen.
$NVDAB $AAPLB $LSK
#BinanceWillListHyperliquid(HYPE) #FedOctoberRateHikeOddsRiseTo69.7%
2
151
Artikel
Übersetzung ansehen
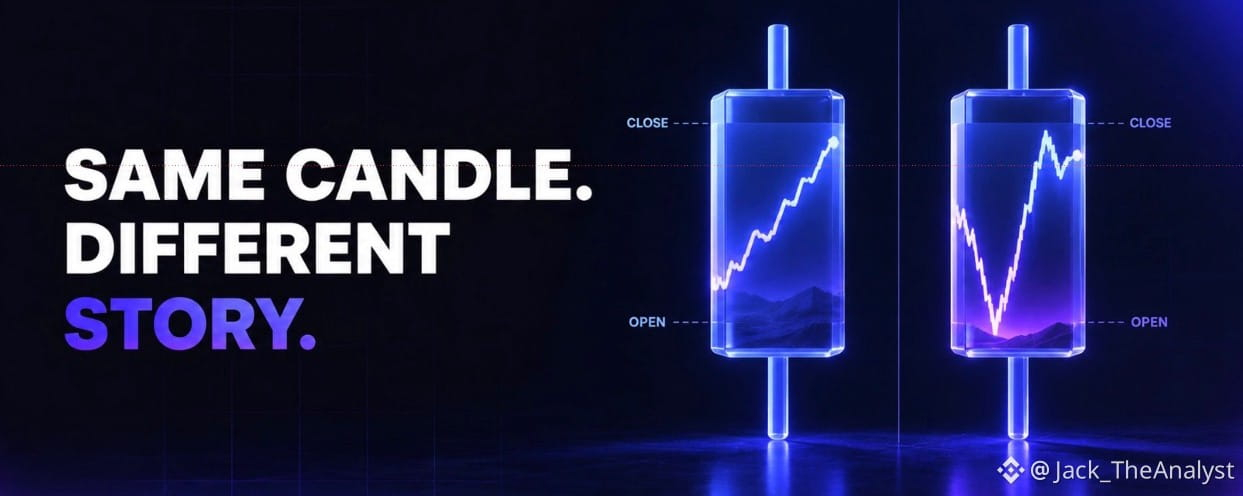
What a Candle Can Hide?Higher-timeframe candles are useful because they compress a large amount of price action into something easy to read. The problem is that two candles with almost identical opens, highs, lows and closes can be created through very different sequences of events.
That sequence can matter when evaluating what actually happened during the session.
Suppose BTC opens at $80,000 and closesat $82,000. In the first scenario, price gradually moves higher throughout the day, pullbacks remain shallow, and most of the final hours are spent near $82,000. Buyers gained ground and were able to maintain it.
Now imagine the same open and close, but BTC first drops to $77,500, aggressively recovers to $83,000 and then falls back to $82,000 before the daily close.
Both sessions finish bullish, but they tell different stories. The second contained a failed move lower, a strong recovery and then selling above the eventual closing price. None of that is fully explained by simply calling the daily candle bullish.
This becomes especially useful around important levels.
Imagine a daily candle closes slightly above resistance. Looking only at the daily chart, it may appear to be a successful breakout. But a lower timeframe might show that price broke resistance early, spent most of the session back below it and only recovered during the final hour.
Compare that with a session that breaks resistance early, retests it from above and spends the remainder of the day building higher. The daily candles could eventually look similar, but the second shows much clearer acceptance above the level.
Lower timeframes can therefore be used as a diagnostic tool rather than simply as another place to search for entries.
When a higher-timeframe candle forms at an important area, look inside it and ask a few basic questions. Which side moved first? Was that move sustained or rejected? Where did price spend most of the session? Did the close confirm the dominant behavior of the day, or did a late move dramatically change the final candle?
You do not need to dissect every daily candle.
Most of the time, the higher timeframe provides enough information on its own.
But around major breakouts, failed moves and turning points, understanding how the candle was built can reveal information that its final shape compresses away.
The candle shows the result.
Sometimes the sequence explains how meaningful that result actually was.
#BTC走势分析 $BTC #PolymarketBankFailureBetsDrawFDICConcern #BlackRockBuildsTokenizedPortfoliosForOndo
{future}(BTCUSDT)
What a Candle Can Hide?
Higher-timeframe candles are useful because they compress a large amount of price action into something easy to read. The problem is that two candles with almost identical opens, highs, lows and closes can be created through very different sequences of events.
That sequence can matter when evaluating what actually happened during the session.
Suppose BTC opens at $80,000 and closesat $82,000. In the first scenario, price gradually moves higher throughout the day, pullbacks remain shallow, and most of the final hours are spent near $82,000. Buyers gained ground and were able to maintain it.
Now imagine the same open and close, but BTC first drops to $77,500, aggressively recovers to $83,000 and then falls back to $82,000 before the daily close.
Both sessions finish bullish, but they tell different stories. The second contained a failed move lower, a strong recovery and then selling above the eventual closing price. None of that is fully explained by simply calling the daily candle bullish.
This becomes especially useful around important levels.
Imagine a daily candle closes slightly above resistance. Looking only at the daily chart, it may appear to be a successful breakout. But a lower timeframe might show that price broke resistance early, spent most of the session back below it and only recovered during the final hour.
Compare that with a session that breaks resistance early, retests it from above and spends the remainder of the day building higher. The daily candles could eventually look similar, but the second shows much clearer acceptance above the level.
Lower timeframes can therefore be used as a diagnostic tool rather than simply as another place to search for entries.
When a higher-timeframe candle forms at an important area, look inside it and ask a few basic questions. Which side moved first? Was that move sustained or rejected? Where did price spend most of the session? Did the close confirm the dominant behavior of the day, or did a late move dramatically change the final candle?
You do not need to dissect every daily candle.
Most of the time, the higher timeframe provides enough information on its own.
But around major breakouts, failed moves and turning points, understanding how the candle was built can reveal information that its final shape compresses away.
The candle shows the result.
Sometimes the sequence explains how meaningful that result actually was.
#BTC走势分析 $BTC #PolymarketBankFailureBetsDrawFDICConcern #BlackRockBuildsTokenizedPortfoliosForOndo
That sequence can matter when evaluating what actually happened during the session.
Suppose BTC opens at $80,000 and closesat $82,000. In the first scenario, price gradually moves higher throughout the day, pullbacks remain shallow, and most of the final hours are spent near $82,000. Buyers gained ground and were able to maintain it.
Now imagine the same open and close, but BTC first drops to $77,500, aggressively recovers to $83,000 and then falls back to $82,000 before the daily close.
Both sessions finish bullish, but they tell different stories. The second contained a failed move lower, a strong recovery and then selling above the eventual closing price. None of that is fully explained by simply calling the daily candle bullish.
This becomes especially useful around important levels.
Imagine a daily candle closes slightly above resistance. Looking only at the daily chart, it may appear to be a successful breakout. But a lower timeframe might show that price broke resistance early, spent most of the session back below it and only recovered during the final hour.
Compare that with a session that breaks resistance early, retests it from above and spends the remainder of the day building higher. The daily candles could eventually look similar, but the second shows much clearer acceptance above the level.
Lower timeframes can therefore be used as a diagnostic tool rather than simply as another place to search for entries.
When a higher-timeframe candle forms at an important area, look inside it and ask a few basic questions. Which side moved first? Was that move sustained or rejected? Where did price spend most of the session? Did the close confirm the dominant behavior of the day, or did a late move dramatically change the final candle?
You do not need to dissect every daily candle.
Most of the time, the higher timeframe provides enough information on its own.
But around major breakouts, failed moves and turning points, understanding how the candle was built can reveal information that its final shape compresses away.
The candle shows the result.
Sometimes the sequence explains how meaningful that result actually was.
#BTC走势分析 $BTC #PolymarketBankFailureBetsDrawFDICConcern #BlackRockBuildsTokenizedPortfoliosForOndo
71
·
--
Bullisch
SOL Swing Long Trade
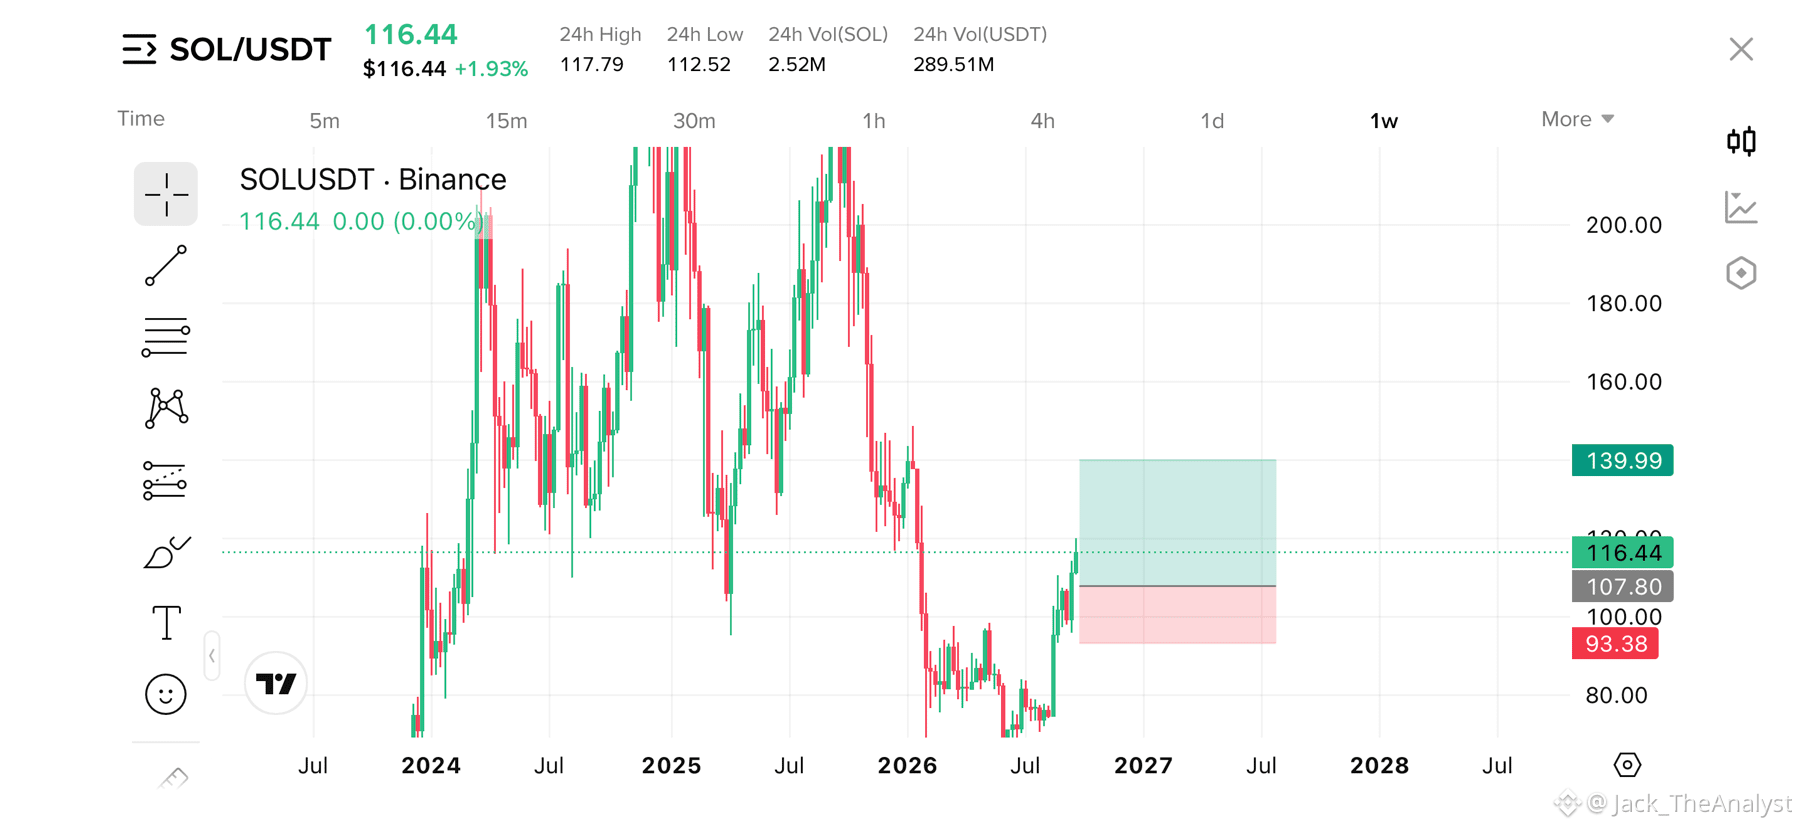
Solana ($SOL) zeigt im Wochenchart ein solides strukturelles Setup und verteidigt wichtige Wertbereiche nach einer lang anhaltenden Korrekturphase.
Der Widerstand wurde durchbrochen, die wöchentliche Kerze hat oberhalb geschlossen und das Niveau wurde erneut getestet.
(RR): ~1 : 2.24
Einstieg: $107.80
Take Profit (TP): $140.00
Stop Loss (SL): $93.38
Teilgewinne können bei $140.00 gebucht werden, dann können wir den Trade bis zur nächsten Stufe halten, bis $200.00 für den finalen Take Profit.
#solonapumping #sol板块 #SolanaUSTD
$NVDAB $AAPLB $AAPL.US
SOL Swing Long Trade
Solana ($SOL) zeigt im Wochenchart ein solides strukturelles Setup und verteidigt wichtige Wertbereiche nach einer lang anhaltenden Korrekturphase.
Der Widerstand wurde durchbrochen, die wöchentliche Kerze hat oberhalb geschlossen und das Niveau wurde erneut getestet.
(RR): ~1 : 2.24
Einstieg: $107.80
Take Profit (TP): $140.00
Stop Loss (SL): $93.38
Teilgewinne können bei $140.00 gebucht werden, dann können wir den Trade bis zur nächsten Stufe halten, bis $200.00 für den finalen Take Profit.
#solonapumping #sol板块 #SolanaUSTD
$NVDAB $AAPLB $AAPL.US
Solana ($SOL) zeigt im Wochenchart ein solides strukturelles Setup und verteidigt wichtige Wertbereiche nach einer lang anhaltenden Korrekturphase.
Der Widerstand wurde durchbrochen, die wöchentliche Kerze hat oberhalb geschlossen und das Niveau wurde erneut getestet.
(RR): ~1 : 2.24
Einstieg: $107.80
Take Profit (TP): $140.00
Stop Loss (SL): $93.38
Teilgewinne können bei $140.00 gebucht werden, dann können wir den Trade bis zur nächsten Stufe halten, bis $200.00 für den finalen Take Profit.
#solonapumping #sol板块 #SolanaUSTD
$NVDAB $AAPLB $AAPL.US
1
78
·
--
Bullisch
#dodgecoin DOGE/USDT
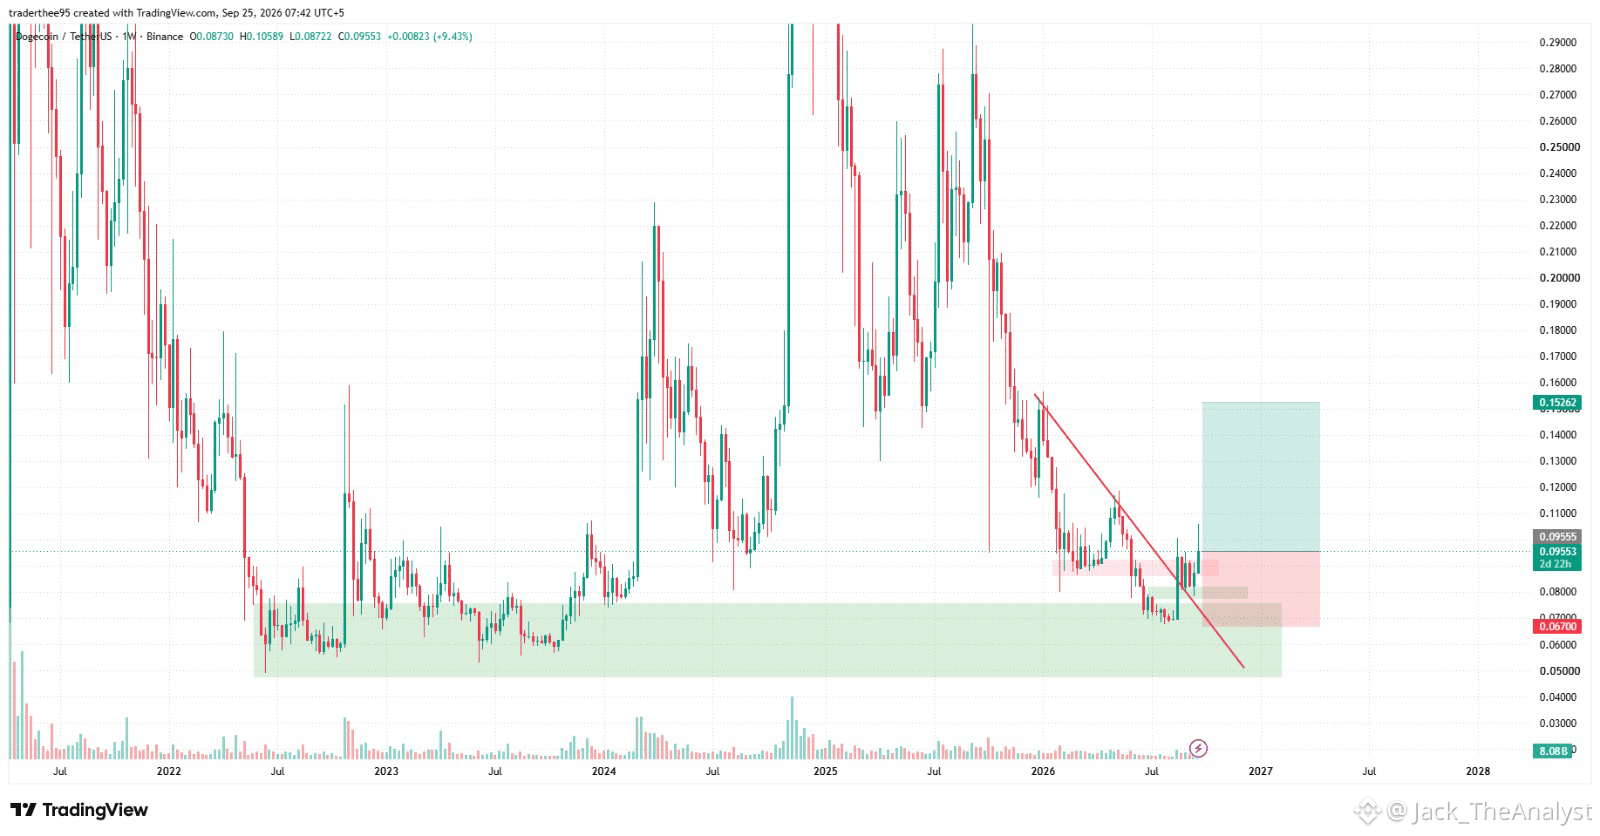
DOGE testete eine wichtige makro-unterstützende Zone erneut (im Bereich von 0,0500 bis 0,0700), die bereits ab Anfang 2021 zurückverfolgt werden kann.
Nach dem Rückprall aus diesem bedeutenden Unterstützungsbereich durchbrach der Kurs die anfängliche Resistance-turned-Support (RBS)-Stufe bei etwa 0,08892 und fiel zeitlich mit einem sauberen Ausbruch über die primäre absteigende Trendlinie zusammen.
Nachdem DOGE die Breakout-Trendlinie zurückerobert hatte, drückte die Kryptowährung weiter, um ihre jüngste Widerstandszone zu durchbrechen—und bestätigte damit eine strukturelle Verschiebung hin zu einem starken bullischen Fortsetzungsszenario.
Einstiegspunkt: ~0,09508 (aktueller Marktpreis oder nur eine kleinere Rücksetzer-Phase).
Stop Loss (SL): 0,06700 (sicher unterhalb der wichtigen strukturellen Unterstützung platziert).
Take Profit (TP): 0,15262 (primäres Kursziel am wichtigen Swing-High-Widerstand).
#Dogecoin #doge⚡ #DOGEUSDT
$AAPL.US $AAPLB $GOOGL.US
#dodgecoin DOGE/USDT
DOGE testete eine wichtige makro-unterstützende Zone erneut (im Bereich von 0,0500 bis 0,0700), die bereits ab Anfang 2021 zurückverfolgt werden kann.
Nach dem Rückprall aus diesem bedeutenden Unterstützungsbereich durchbrach der Kurs die anfängliche Resistance-turned-Support (RBS)-Stufe bei etwa 0,08892 und fiel zeitlich mit einem sauberen Ausbruch über die primäre absteigende Trendlinie zusammen.
Nachdem DOGE die Breakout-Trendlinie zurückerobert hatte, drückte die Kryptowährung weiter, um ihre jüngste Widerstandszone zu durchbrechen—und bestätigte damit eine strukturelle Verschiebung hin zu einem starken bullischen Fortsetzungsszenario.
Einstiegspunkt: ~0,09508 (aktueller Marktpreis oder nur eine kleinere Rücksetzer-Phase).
Stop Loss (SL): 0,06700 (sicher unterhalb der wichtigen strukturellen Unterstützung platziert).
Take Profit (TP): 0,15262 (primäres Kursziel am wichtigen Swing-High-Widerstand).
#Dogecoin #doge⚡ #DOGEUSDT
$AAPL.US $AAPLB $GOOGL.US
DOGE testete eine wichtige makro-unterstützende Zone erneut (im Bereich von 0,0500 bis 0,0700), die bereits ab Anfang 2021 zurückverfolgt werden kann.
Nach dem Rückprall aus diesem bedeutenden Unterstützungsbereich durchbrach der Kurs die anfängliche Resistance-turned-Support (RBS)-Stufe bei etwa 0,08892 und fiel zeitlich mit einem sauberen Ausbruch über die primäre absteigende Trendlinie zusammen.
Nachdem DOGE die Breakout-Trendlinie zurückerobert hatte, drückte die Kryptowährung weiter, um ihre jüngste Widerstandszone zu durchbrechen—und bestätigte damit eine strukturelle Verschiebung hin zu einem starken bullischen Fortsetzungsszenario.
Einstiegspunkt: ~0,09508 (aktueller Marktpreis oder nur eine kleinere Rücksetzer-Phase).
Stop Loss (SL): 0,06700 (sicher unterhalb der wichtigen strukturellen Unterstützung platziert).
Take Profit (TP): 0,15262 (primäres Kursziel am wichtigen Swing-High-Widerstand).
#Dogecoin #doge⚡ #DOGEUSDT
$AAPL.US $AAPLB $GOOGL.US
1
195
·
--
Bullisch
#Litecoin Major Multi-Year Accumulation Breakdown & Rebound — Long Setup
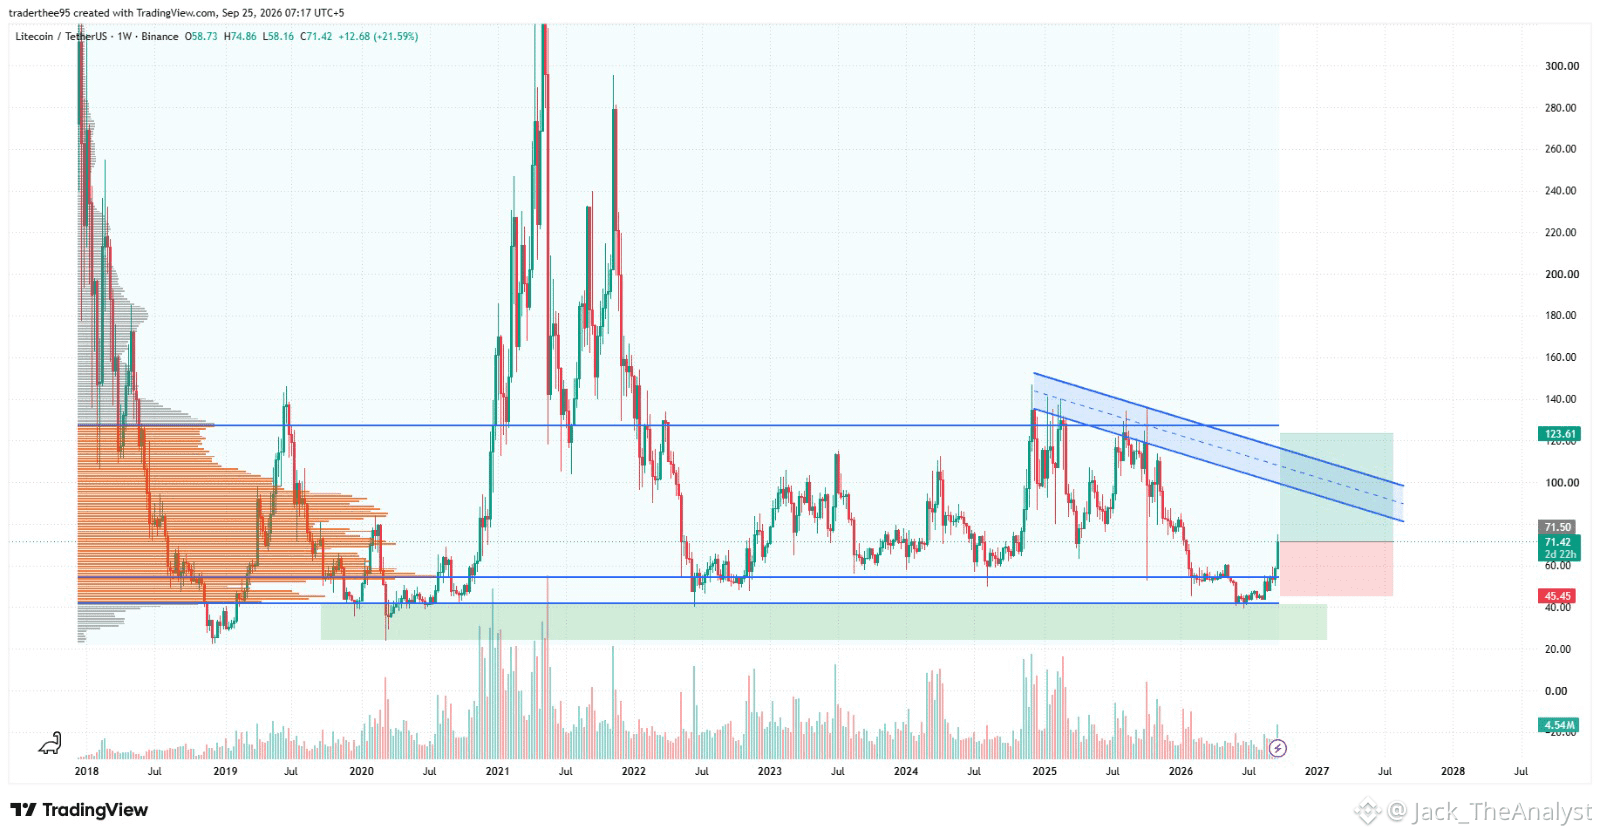
Die Kursbewegung von Litecoin hat kürzlich einen wichtigen Widerstandsbereich um 60,47 $ überschritten. Dieser Bereich wirkt nun als bedeutende Unterstützungszone. Diese Verschiebung in der Marktstruktur sollte beobachtet werden, da ein Halten des Preises über dieser Region die Möglichkeit stützen könnte, dass der jüngste Rückgang unter die vorherige Spanne eher eine Abweichung war als ein nachhaltiger Breakdown.
Volume Profile: Solider Aufbau von Akkumulation in niedrigeren Bereichen deutet darauf hin, dass langfristige Käufer diese Zone verteidigen.
Einstiegszone: Aktueller Marktpreis (71,04) oder bei kleineren Rücksetzern in Richtung 60,00–65,00 $
Take Profit (TP): 123,60 $ (Oberer Widerstand & Channel-Ziel)
Stop Loss (SL): 45,45 $ (Unterhalb der wichtigen strukturellen Unterstützung)
#Litecoin #LitecoinUpdate #LitecoinRevolution
$NVDAB $AAPLB $AAPL.US
#Litecoin Major Multi-Year Accumulation Breakdown & Rebound — Long Setup
Die Kursbewegung von Litecoin hat kürzlich einen wichtigen Widerstandsbereich um 60,47 $ überschritten. Dieser Bereich wirkt nun als bedeutende Unterstützungszone. Diese Verschiebung in der Marktstruktur sollte beobachtet werden, da ein Halten des Preises über dieser Region die Möglichkeit stützen könnte, dass der jüngste Rückgang unter die vorherige Spanne eher eine Abweichung war als ein nachhaltiger Breakdown.
Volume Profile: Solider Aufbau von Akkumulation in niedrigeren Bereichen deutet darauf hin, dass langfristige Käufer diese Zone verteidigen.
Einstiegszone: Aktueller Marktpreis (71,04) oder bei kleineren Rücksetzern in Richtung 60,00–65,00 $
Take Profit (TP): 123,60 $ (Oberer Widerstand & Channel-Ziel)
Stop Loss (SL): 45,45 $ (Unterhalb der wichtigen strukturellen Unterstützung)
#Litecoin #LitecoinUpdate #LitecoinRevolution
$NVDAB $AAPLB $AAPL.US
Die Kursbewegung von Litecoin hat kürzlich einen wichtigen Widerstandsbereich um 60,47 $ überschritten. Dieser Bereich wirkt nun als bedeutende Unterstützungszone. Diese Verschiebung in der Marktstruktur sollte beobachtet werden, da ein Halten des Preises über dieser Region die Möglichkeit stützen könnte, dass der jüngste Rückgang unter die vorherige Spanne eher eine Abweichung war als ein nachhaltiger Breakdown.
Volume Profile: Solider Aufbau von Akkumulation in niedrigeren Bereichen deutet darauf hin, dass langfristige Käufer diese Zone verteidigen.
Einstiegszone: Aktueller Marktpreis (71,04) oder bei kleineren Rücksetzern in Richtung 60,00–65,00 $
Take Profit (TP): 123,60 $ (Oberer Widerstand & Channel-Ziel)
Stop Loss (SL): 45,45 $ (Unterhalb der wichtigen strukturellen Unterstützung)
#Litecoin #LitecoinUpdate #LitecoinRevolution
$NVDAB $AAPLB $AAPL.US
1
135
·
--
Bullisch
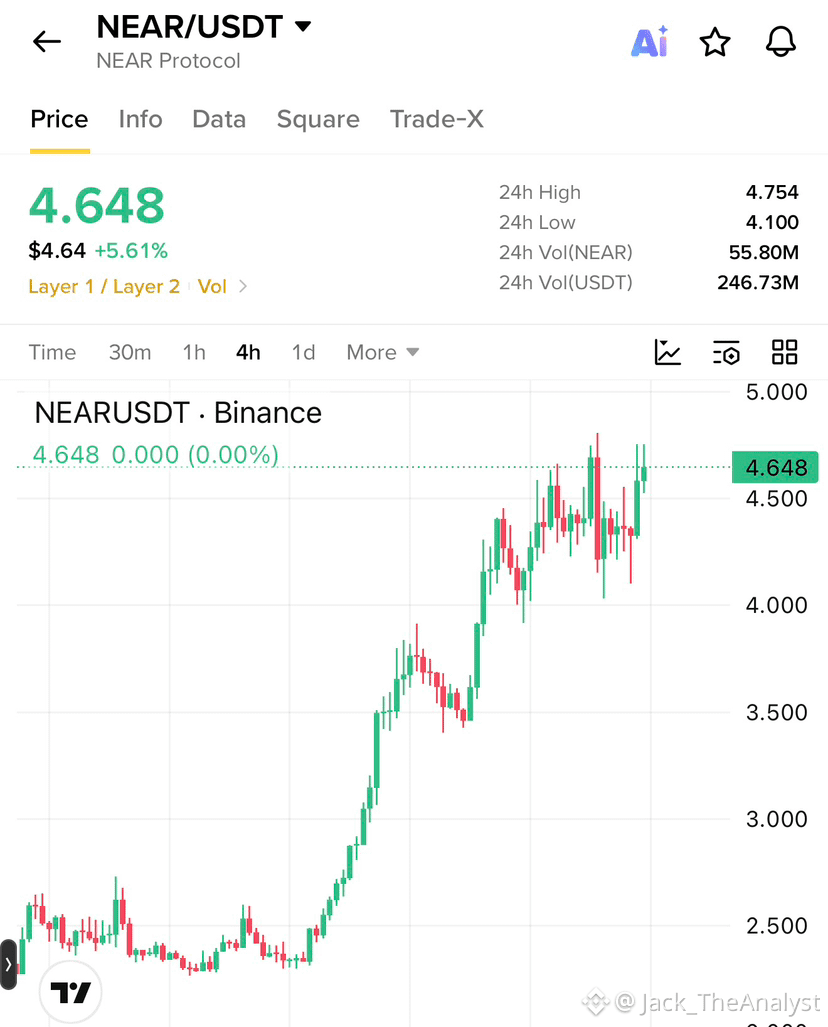
NEAR Protocol ($NEAR) zeigt auf dem 4-Stunden-Chart massiven bullishen Momentum: Ausbruch aus einer mehrmonatigen Konsolidierungsphase, um $4.65 zu erreichen.
Für Käufe: Ein bestätigter 4-Stunden-Kerze-Schluss über $4.75 ebnet den Weg zu $5.00, mit sekundären Swing-Zielen bei $5.50 und $6.00.
Bearishes / Pullback-Szenario: Scheitert der Ausbruch über $4.75, könnte es zu kurzfristiger Gewinnmitnahme kommen, die in Richtung der Unterstützungszone $4.10 – $4.20 fällt, bevor ein weiterer Versuch nach oben erfolgt.
#Near #NEARUSDT #NEAR🚀🚀🚀 $NEAR
{spot}(NEARUSDT)
NEAR Protocol ($NEAR ) zeigt auf dem 4-Stunden-Chart massiven bullishen Momentum: Ausbruch aus einer mehrmonatigen Konsolidierungsphase, um $4.65 zu erreichen.
Für Käufe: Ein bestätigter 4-Stunden-Kerze-Schluss über $4.75 ebnet den Weg zu $5.00, mit sekundären Swing-Zielen bei $5.50 und $6.00.
Bearishes / Pullback-Szenario: Scheitert der Ausbruch über $4.75, könnte es zu kurzfristiger Gewinnmitnahme kommen, die in Richtung der Unterstützungszone $4.10 – $4.20 fällt, bevor ein weiterer Versuch nach oben erfolgt.
#Near #NEARUSDT #NEAR🚀🚀🚀 $NEAR
Für Käufe: Ein bestätigter 4-Stunden-Kerze-Schluss über $4.75 ebnet den Weg zu $5.00, mit sekundären Swing-Zielen bei $5.50 und $6.00.
Bearishes / Pullback-Szenario: Scheitert der Ausbruch über $4.75, könnte es zu kurzfristiger Gewinnmitnahme kommen, die in Richtung der Unterstützungszone $4.10 – $4.20 fällt, bevor ein weiterer Versuch nach oben erfolgt.
#Near #NEARUSDT #NEAR🚀🚀🚀 $NEAR
3
717
Anmelden und weiter Inhalte entdecken
Krypto-Nutzer weltweit auf Binance Square kennenlernen
⚡️ Bleib in Sachen Krypto stets am Puls.
💬 Die weltgrößte Kryptobörse vertraut darauf.
👍 Erhalte verlässliche Einblicke von verifizierten Creators.
E-Mail-Adresse/Telefonnummer
Trendthemen
CircleMints500MUSDCOnSolana
2,145 Aufrufe
184 Kommentare
💰 MASSIV: Circle prägt $500M USDC auf Solana!
Circle hat gerade 500 Millionen $USDC auf Solana in 2 Transaktionen geprägt ($250M + $250M) am 25. September – in nur 5,5 Stunden! 🚀
Solana hält jetzt $7,48B+ $USDC – über 50% seines $14,7B Stablecoin-Angebots.
Warum Solana?
⚡️ Geschwindigkeit: 65k TPS
💸 Niedrige Gebühren: $0.00025
🔥 DeFi-Hub: Jupiter, Raydium mit Pump
Das ist eine der größten Prägeserien an einem einzigen Tag & ein Signal für eine enorme, institutionelle Nachfrage nach der Solana-Ökonomie.
Bullish für $SOL? 👇
#Circle #USDC #Solana #Stablecoin #DeFi#circlemints500musdconsolana
True News
·8 Likes
·2.3k Aufrufe
PolymarketBankFailureBetsDrawFDICConcern
13,635 Aufrufe
437 Kommentare
BlackRockBuildsTokenizedPortfoliosForOndo
10,534 Aufrufe
307 Kommentare