$ETH 📊 ETH (Ethereum) Technical Analysis — Daily Chart
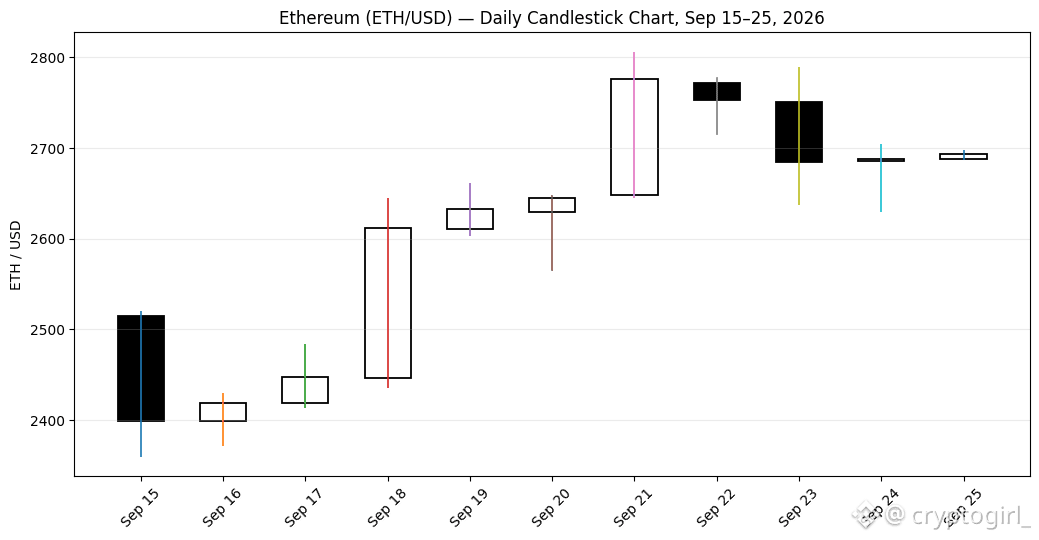
Recent ETH daily data shows a strong move from around $2,399 on Sep 15 to $2,693 on Sep 25, with a high of about $2,805 on Sep 21.
Key chart levels:
Current area: ~$2,690
Recent resistance: ~$2,780–$2,805
Near support: ~$2,630–$2,650
Stronger support: ~$2,560–$2,600
🕯️ Candle reading
Sep 18–21: Large bullish candles show strong upward momentum.
Sep 21: ETH reached ~$2,805 but closed lower than its high, showing selling pressure near the top.
Sep 22–23: Bearish candles indicate a pullback from the ~$2,800 region.
Sep 24–25: Price stabilized around $2,690, suggesting consolidation.
Reuters also reported that ETH had broken above a bull-flag pattern, with $2,661.52 identified as an important breakout level; it noted ~$2,560–$2,565 as a level to watch on a downside move.
Recent ETH daily data shows a strong move from around $2,399 on Sep 15 to $2,693 on Sep 25, with a high of about $2,805 on Sep 21.
Key chart levels:
Current area: ~$2,690
Recent resistance: ~$2,780–$2,805
Near support: ~$2,630–$2,650
Stronger support: ~$2,560–$2,600
🕯️ Candle reading
Sep 18–21: Large bullish candles show strong upward momentum.
Sep 21: ETH reached ~$2,805 but closed lower than its high, showing selling pressure near the top.
Sep 22–23: Bearish candles indicate a pullback from the ~$2,800 region.
Sep 24–25: Price stabilized around $2,690, suggesting consolidation.
Reuters also reported that ETH had broken above a bull-flag pattern, with $2,661.52 identified as an important breakout level; it noted ~$2,560–$2,565 as a level to watch on a downside move.