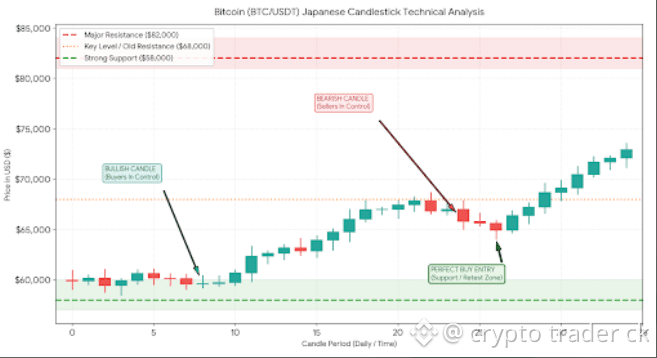
#BTC☀️ Each candle represents price movement over a specific time frame (e.g., 1 Day or 1 Hour):
$BTC Green Candle (Bullish): Formed when the Closing Price is higher than the Opening Price. This indicates buyers are in control.
• Red Candle (Bearish): Formed when the Closing Price is lower than the Opening Price. This indicates selling pressure dominates.
• Body (Solid Section): Represents the range between the Open and Close prices.
• Wick / Shadow (Thin Lines): Shows the highest and lowest prices reached during that time period. #RiskManagement #bulishmomentum
$BTC Green Candle (Bullish): Formed when the Closing Price is higher than the Opening Price. This indicates buyers are in control.
• Red Candle (Bearish): Formed when the Closing Price is lower than the Opening Price. This indicates selling pressure dominates.
• Body (Solid Section): Represents the range between the Open and Close prices.
• Wick / Shadow (Thin Lines): Shows the highest and lowest prices reached during that time period. #RiskManagement #bulishmomentum