Ethereum Analysis & Market Brief: Testing Critical Support Near $2,650
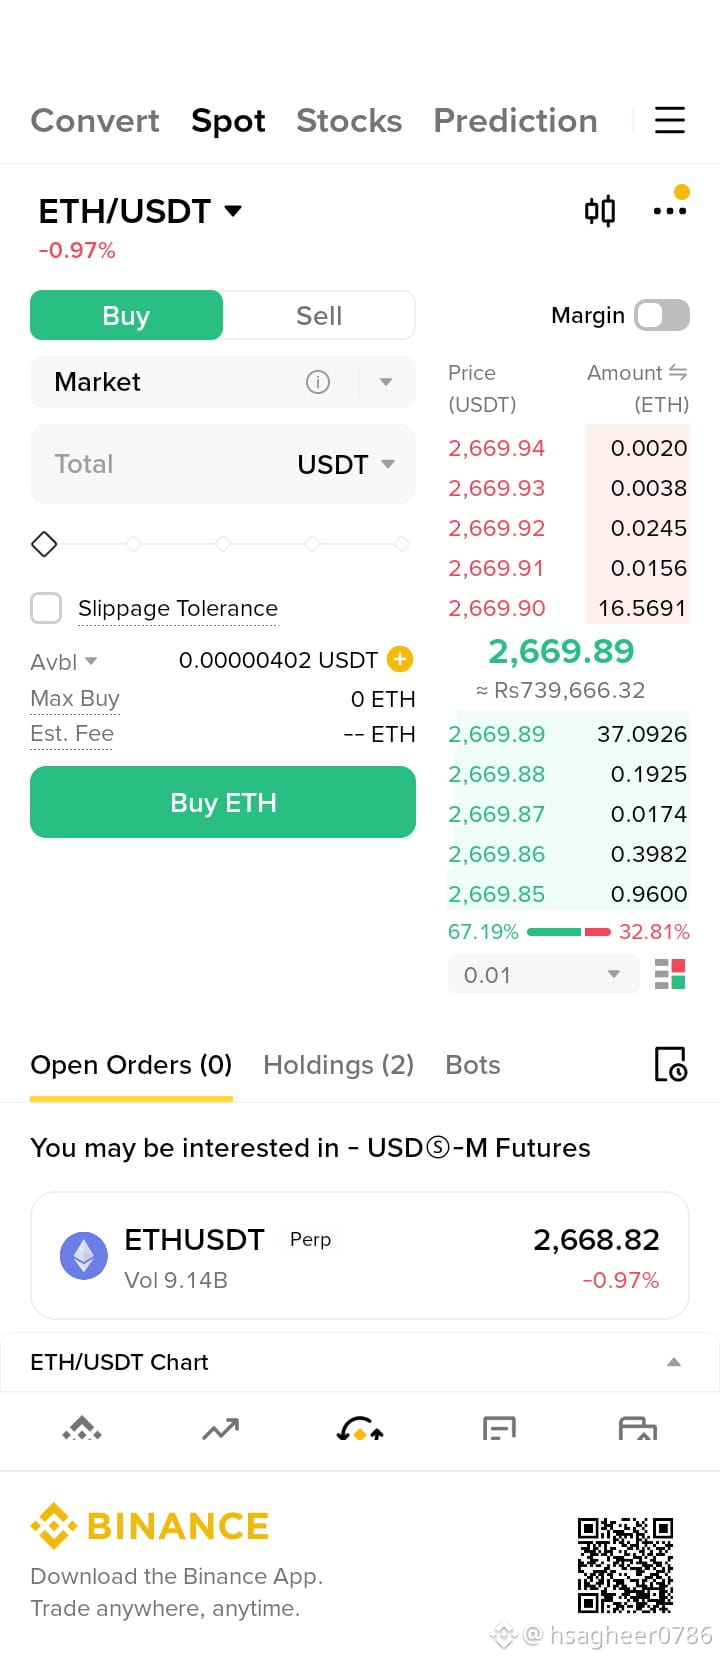
Ethereum (ETH) is trading around $2,640–$2,660, consolidating after being rejected at the critical $2,700–$2,780 resistance zone. Following broader market tailwinds and record spot ETF inflows earlier in the month, capital rotation has slowed down slightly, putting ETH in a pivotal retest zone.
Key Technical & Fundamental Drivers
ETF Capital Inflows & Outflows: Spot ETH ETFs saw steady net institutional demand through mid-September, but uneven flows have kept bulls cautious near multi-month resistance levels.
ETH/BTC Ratio Breakout: The ETH-to-BTC ratio broke above a multi-year downtrend line earlier this month, signaling capital rotation back into Ethereum layer-1 infrastructure.
$2,700 Ceiling: The $2,700–$2,705 level served as immediate overhead supply during recent sessions, rejecting upward momentum and forcing a short-term pullback.
Key Technical Levels
Level TypePrice TargetMarket ContextPrimary Resistance$2,700 – $2,785Local session high; a clean daily close above reopens a run toward $2,950.Immediate Support Band$2,625 – $2,670Former September breakout region turned short-term demand floor.Key Confluence Support$2,540 – $2,560Crucial line in the sand; aligns with 20-day EMA and 100-week EMA confluence.
Actionable Trading Tips for Today
Watch the $2,625–$2,670 Retest: Avoid opening aggressive long positions while price sits directly under $2,700. Look for bullish reversal confirmation (e.g., strong volume spike or double bottom) around the $2,625–$2,670 support band.
Breakout Trigger Above $2,700: Conservative swing traders should wait for a clean 4-hour or daily close above $2,700 to target $2,800 and $2,950.
Invalidation & Risk Control Below $2,540: A breakdown and daily close beneath $2,540 invalidates the bullish recovery structure, risking a broader retracement back toward lower support levels ($2,400–$2,430).
$ETH
#ETH🔥🔥🔥🔥🔥🔥 #ENA #Ethereum
Ethereum (ETH) is trading around $2,640–$2,660, consolidating after being rejected at the critical $2,700–$2,780 resistance zone. Following broader market tailwinds and record spot ETF inflows earlier in the month, capital rotation has slowed down slightly, putting ETH in a pivotal retest zone.
Key Technical & Fundamental Drivers
ETF Capital Inflows & Outflows: Spot ETH ETFs saw steady net institutional demand through mid-September, but uneven flows have kept bulls cautious near multi-month resistance levels.
ETH/BTC Ratio Breakout: The ETH-to-BTC ratio broke above a multi-year downtrend line earlier this month, signaling capital rotation back into Ethereum layer-1 infrastructure.
$2,700 Ceiling: The $2,700–$2,705 level served as immediate overhead supply during recent sessions, rejecting upward momentum and forcing a short-term pullback.
Key Technical Levels
Level TypePrice TargetMarket ContextPrimary Resistance$2,700 – $2,785Local session high; a clean daily close above reopens a run toward $2,950.Immediate Support Band$2,625 – $2,670Former September breakout region turned short-term demand floor.Key Confluence Support$2,540 – $2,560Crucial line in the sand; aligns with 20-day EMA and 100-week EMA confluence.
Actionable Trading Tips for Today
Watch the $2,625–$2,670 Retest: Avoid opening aggressive long positions while price sits directly under $2,700. Look for bullish reversal confirmation (e.g., strong volume spike or double bottom) around the $2,625–$2,670 support band.
Breakout Trigger Above $2,700: Conservative swing traders should wait for a clean 4-hour or daily close above $2,700 to target $2,800 and $2,950.
Invalidation & Risk Control Below $2,540: A breakdown and daily close beneath $2,540 invalidates the bullish recovery structure, risking a broader retracement back toward lower support levels ($2,400–$2,430).
$ETH
#ETH🔥🔥🔥🔥🔥🔥 #ENA #Ethereum