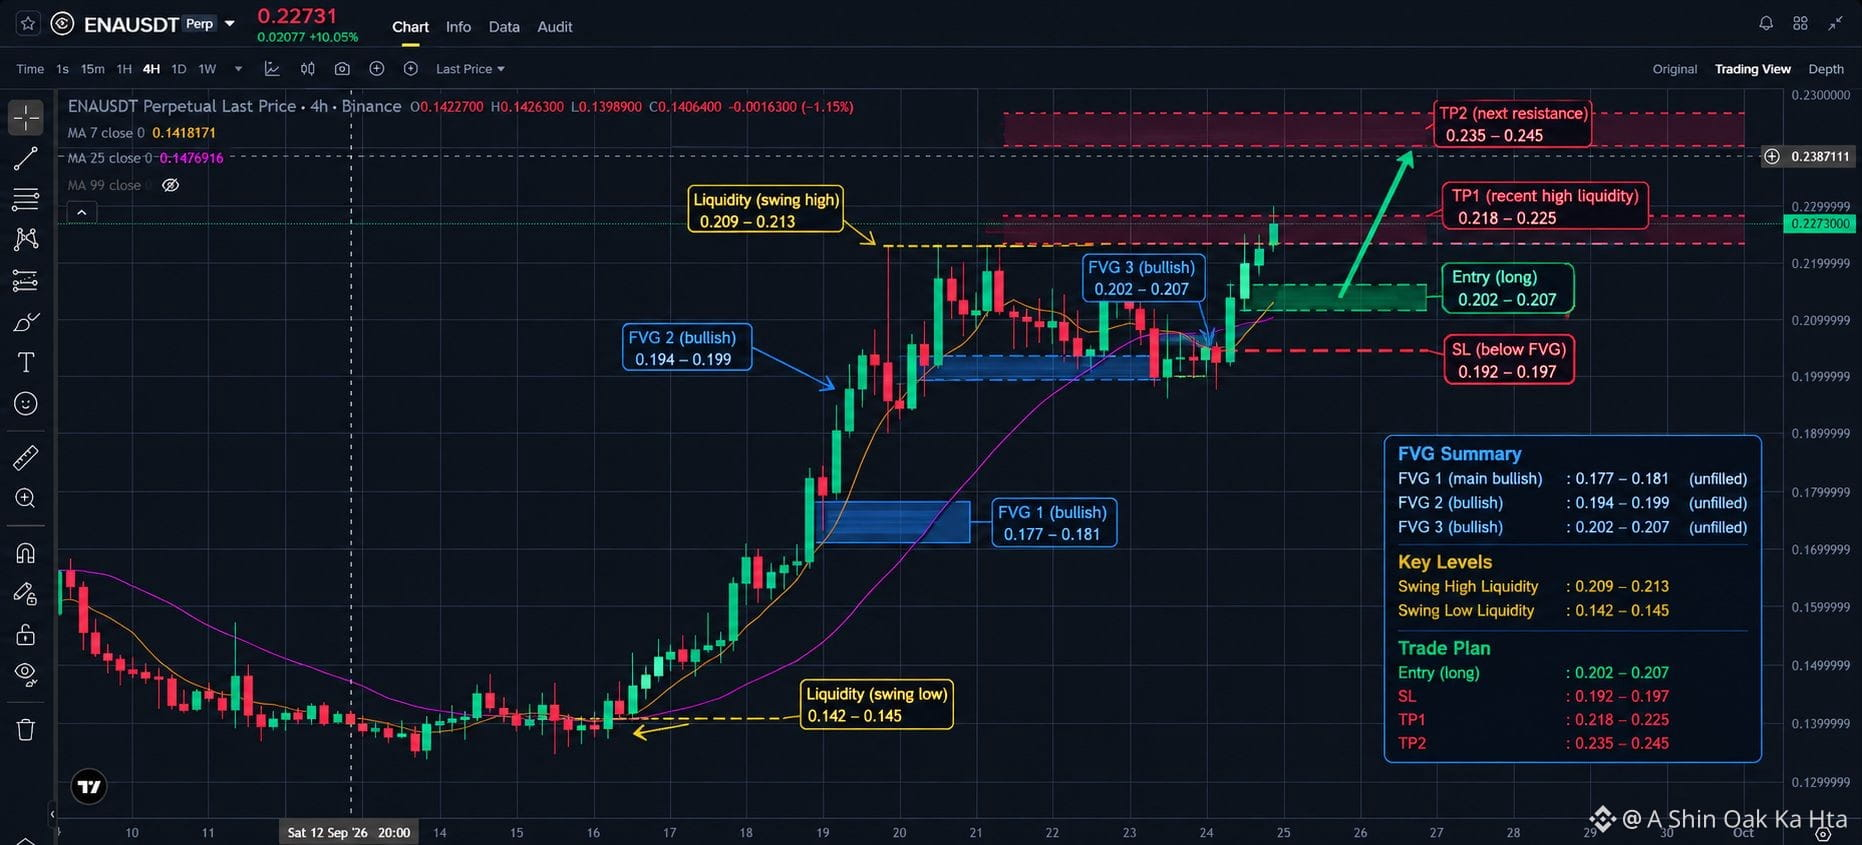
ENA/USDT 4H — FVG Setup & Liquidity Map
ENA is showing strong bullish momentum on the 4H chart, with price trading above the key moving averages and pushing toward previous liquidity.
🔹 Bullish FVG zones
• FVG #1: 0.177–0.181
• FVG #2: 0.194–0.199
• FVG #3: 0.202–0.207
The 0.202–0.207 area is the most recent bullish imbalance and could be an important zone to watch if price retraces.
💧 Liquidity
• Recent swing-high liquidity: 0.209–0.213
• Major external liquidity / previous high: around 0.2387
📈 Potential scenario
If ENA holds the 0.202–0.207 FVG and continues to make higher highs, the next areas I’m watching are:
🎯 0.218–0.225
🎯 0.235–0.245
⚠️ If price loses the FVG and breaks below the nearby support structure, the bullish setup becomes weaker.
This is my technical analysis, not financial advice. Always manage risk and wait for confirmation rather than chasing a breakout.
#ENA #ENAUSDT #Crypto #BinanceSquare #FVG #PriceAction #Liquidity #Trading #TechnicalAnalysis
ENA is showing strong bullish momentum on the 4H chart, with price trading above the key moving averages and pushing toward previous liquidity.
🔹 Bullish FVG zones
• FVG #1: 0.177–0.181
• FVG #2: 0.194–0.199
• FVG #3: 0.202–0.207
The 0.202–0.207 area is the most recent bullish imbalance and could be an important zone to watch if price retraces.
💧 Liquidity
• Recent swing-high liquidity: 0.209–0.213
• Major external liquidity / previous high: around 0.2387
📈 Potential scenario
If ENA holds the 0.202–0.207 FVG and continues to make higher highs, the next areas I’m watching are:
🎯 0.218–0.225
🎯 0.235–0.245
⚠️ If price loses the FVG and breaks below the nearby support structure, the bullish setup becomes weaker.
This is my technical analysis, not financial advice. Always manage risk and wait for confirmation rather than chasing a breakout.
#ENA #ENAUSDT #Crypto #BinanceSquare #FVG #PriceAction #Liquidity #Trading #TechnicalAnalysis