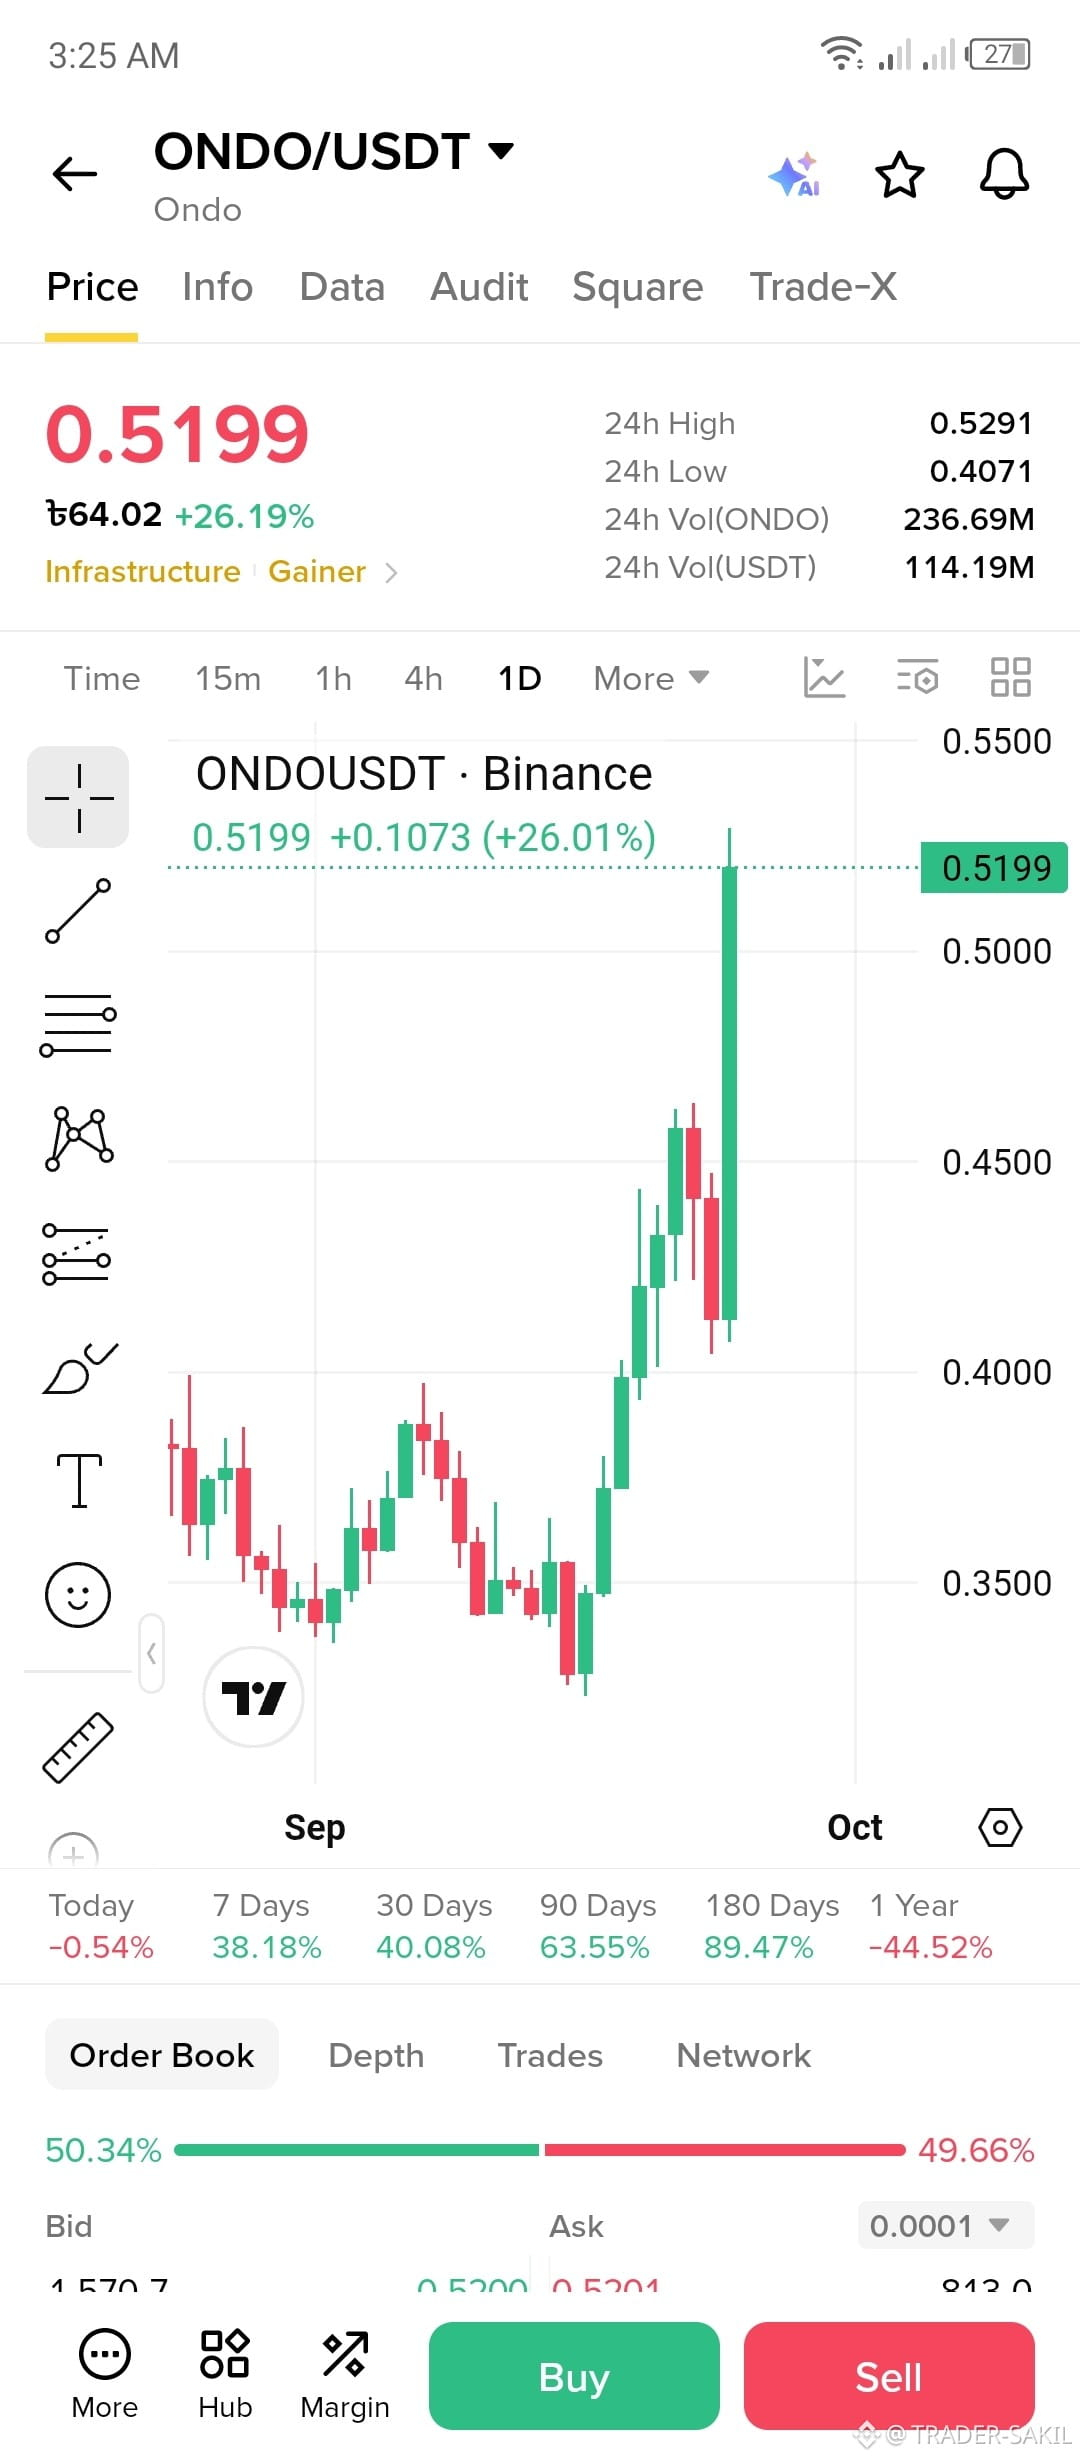
The chart is $ONDO on Binance, 1D timeframe. The displayed price is $0.5199, showing about +26.19% on the current 24-hour move.
Main trend:
ONDO has shifted into a strong bullish phase after trading mostly around $0.34–$0.40.
Price recently broke above $0.40, then pushed through $0.45 and is now testing the $0.52 area.
The latest daily candle is very large, showing strong buying momentum.
Performance shown on the screen: 7D +38.18%, 30D +40.08%, 90D +63.55%, 180D +89.47%, while the 1-year figure remains -44.52%.
Key levels:
Resistance: $0.529–$0.55
Support: around $0.50, then $0.45
Stronger lower support: $0.40–$0.41
A clean break and daily close above $0.529–$0.55 could indicate continued strength, while rejection there could lead to a pullback toward the $0.50 or $0.45 zones.
Caveats: This move is already quite extended, so chasing a large green candle carries higher pullback risk. The order book shown is almost balanced (50.34% bid vs 49.66% ask), but that is only a snapshot and does not reliably predict the next move. Also, the screen shows “Today -0.54%” while the 24-hour figure is +26.19%; these metrics may use different reference periods, so they shouldn't be compared directly.
Main trend:
ONDO has shifted into a strong bullish phase after trading mostly around $0.34–$0.40.
Price recently broke above $0.40, then pushed through $0.45 and is now testing the $0.52 area.
The latest daily candle is very large, showing strong buying momentum.
Performance shown on the screen: 7D +38.18%, 30D +40.08%, 90D +63.55%, 180D +89.47%, while the 1-year figure remains -44.52%.
Key levels:
Resistance: $0.529–$0.55
Support: around $0.50, then $0.45
Stronger lower support: $0.40–$0.41
A clean break and daily close above $0.529–$0.55 could indicate continued strength, while rejection there could lead to a pullback toward the $0.50 or $0.45 zones.
Caveats: This move is already quite extended, so chasing a large green candle carries higher pullback risk. The order book shown is almost balanced (50.34% bid vs 49.66% ask), but that is only a snapshot and does not reliably predict the next move. Also, the screen shows “Today -0.54%” while the 24-hour figure is +26.19%; these metrics may use different reference periods, so they shouldn't be compared directly.